The Prognostic Value of the Merkel Cell Polyomavirus Serum Antibody Test: A Dual Institutional Observational Study
2024
Merkel Cell Carcinoma
In this preprint, subsequently published in Cancer, we evaluate the prognostic value of the Merkel Cell Polyomavirus serum antibody test
Author
David M. Miller MD PhD, Sophia Z. Shalhout PhD, Kayla Wright, Matt Miller, Howard L. Kaufman MD5, Kevin S. Emerick MD, Harrison Reeder PhD, Ann W. Silk MD, Manisha Thakuria MD
Published
March 19, 2024
Publication Details
This is a preprint. Please see the final publication at Cancer. The final version of this manuscript has substantial modifications.
Authors: David M. Miller1,2,3* MD PhD, Sophia Z. Shalhout3,4,6 PhD, Kayla Wright4, Matt Miller1, Howard L. Kaufman MD5, Kevin S. Emerick MD3,6, Harrison Reeder PhD7, Ann W. Silk MD3,8, Manisha Thakuria MD3,9
1Department of Medicine, Division of Hematology/Oncology, 2Department of Dermatology, Massachusetts General Hospital, Boston, MA 3Harvard Medical School, Boston, MA 4Mike Toth Head and Neck Cancer Research Center, Massachusetts Eye and Ear Infirmary, Boston, MA 5Department of Surgery, Massachusetts General Hospital, Boston, MA 6Department of Otolaryngology, Division and Head and Neck Surgical Oncology, Massachusetts Eye and Ear Infirmary, Boston, MA 7Biostatistics, Massachusetts General Hospital,Boston, MA 8Department of Medical Oncology, Dana-Farber Cancer Institute, Boston MA 9Department of Dermatology, Brigham and Women’s Hospital, Boston MA
Funding sources: Project Data Sphere, ECOG-ACRIN
Keywords: Merkel cell carcinoma, Merkel cell polyomavirus serum, antibody, AMERK, blood-based biomarker
Abbreviations: AJCC: American Joint Committee on Cancer, AMERK: anti-Merkel cell panel, ANOVA: analysis of variance, BH: Benjamini-Hochberg, BWH: Brigham and Women’s Hospital, CI: confidence interval, ctDNA: circulating tumor DNA, DFCI: Dana-Farber Cancer Institute, DSS: disease-specific survival, Dx: diagnosis, ECOG: Eastern Cooperative Oncology Group, EFS: event-free survival, HR: hazard ratio, IgG: immunoglobulin G, MCC: Merkel cell carcinoma, MCPyV: Merkel cell polyomavirus, MGB: Mass General Brigham, MGH: Massachusetts General Hospital, MICE: multiple imputation with chained events, MSS: Merkel cell carcinoma-specific survival, NCCN: National Comprehensive Cancer Network, OS: overall survival, RFS: recurrence-free survival, SHR: subdistribution hazard ratio, T-Ag: Merkel cell polyomavirus T-antigen (T-Ag)
Abstract
Background
Merkel cell carcinoma (MCC) is an aggressive malignancy with the potential for a poor prognosis. Biomarkers that predict clinical outcomes are limited. The Merkel cell polyomavirus (MCPyV) serum antibody test (AMERK) has been shown in a single-institution study to be associated with improved recurrence-free survival.
Objective
The primary objective of the study was to evaluate the association between initial AMERK serostatus and survival. Secondary objectives included evaluating the correlation between initial AMERK titer level and tumor burden.
Methods
A dual-institution retrospective cohort study was performed evaluating patients who had an initial AMERK test within 90 days of their initial diagnosis of MCC. Regression models were used to assess the association of recurrence-free survival (RFS), event-free survival (EFS), overall survival (OS) and Merkel cell carcinoma-specific survival (MSS) with serostatus, after controlling for age, gender, stage, immunosuppression, performance status and initial treatment. One-way ANOVA on ranks was used to evaluate the relationship between the initial AMERK titer and surrogates of tumor burden, including clinical stage, tumor stage, nodal stage, greatest tumor size and disease extent. Quantitative assessments were considered exploratory. Significance testing was performed to evaluate the relationship between effect size and variability in the data; however, a strict significance level was not drawn.
Results
261 subjects with a confirmed diagnosis of MCC had an AMERK test within 90 days of diagnosis. 49.4% (129/261) of the subjects had an initial seropositive AMERK (titer ≥75). On multivariable regression analysis, seropositivity was associated with improved RFS (sub-distribution hazard ratio (SHR) 0.48, 95% CI 0.3-0.78), EFS (HR 0.58, 95% CI 0.38-0.87), OS (HR 0.62, 95% CI 0.36-1.07) and MSS (SHR 0.63, 95% CI 0.32-1.23). Initial AMERK titer was strongly associated with clinical stage (p <0.0001), tumor stage (p < 0.0001), tumor size (p < 0.0001), nodal stage (p < 0.0001), and disease extent (p < 0.0001). When subjects were stratified according to clinical stage, seropositivity was only associated with improved survival in patients with localized disease on presentation.
Limitations
The major limitations of this study include its retrospective nature and exploratory data analysis.
Conclusion The presence of circulating antibodies to MCPyV oncoproteins is associated with improved survival outcomes in patients with localized disease at presentation. By distinguishing patients based on their risk profiles more accurately, the AMERK test could play an important role in refining and personalizing treatment approaches for MCC.
Introduction
Merkel cell carcinoma (MCC) is a rare, increasingly prevalent neuroendocrine carcinoma of the skin, often presenting with metastatic disease at diagnosis.1,2 Its recurrence rates, reported between 27-48%, have been primarily derived from small to medium-sized institutional datasets.3–7 Large cancer registries like SEER do not systematically capture recurrence or disease-specific survival (DSS) data for MCC, highlighting a critical gap in risk stratification for patients. Currently, risk assessment in MCC primarily relies on tumor characteristics and disease extent at initial evaluation. Notably, serum IgG antibodies against the Merkel cell polyomavirus (MCPyV) T-antigen (T-Ag) have been found in about half of MCC patients. A study from the University of Washington demonstrated that MCPyV T-Ag IgG seropositivity at diagnosis correlates with a reduced recurrence hazard.8 In a multivariable analysis, seropositive patients tested within 90 days of diagnosis showed a decreased hazard of recurrence compared to seronegative patients.9 This finding led to the development and clinical implementation of the Anti-Merkel Cell Panel (AMERK), a laboratory test now available for clinical use.
The purpose of our study was to further characterize the prognostic value of the AMERK test in a dual-institution observational study. Specifically, we sought to better understand the association of AMERK serostatus and additional survival endpoints, including recurrence-free survival (RFS), event-free survival (EFS), overall survival (OS) and MCC-specific survival (MSS). Our investigation extended to analyzing the correlation between the initial AMERK titer levels and the extent of disease burden. Furthermore, we evaluated how clinical staging might modify the impact of serostatus on patient survival outcomes. Our findings indicate a positive association between initial AMERK seropositivity and enhanced survival, predominantly observed in patients diagnosed with early-stage disease.
Materials and Methods
Registration
The protocol of the study was registered at Open Science Foundation prior to the analysis of the data.
Data source and patient selection
We performed an Institutional Review Board-approved retrospective study of patients with MCC at Brigham and Women’s Hospital (BWH)/Dana-Farber Cancer Institute (DFCI) and Massachusetts General Hospital (MGH) treated between January 1, 2015, and September 29, 2022. Only patients with an AMERK test drawn within 90 days of diagnosis and processed by the University of Washington Clinical Immunology Laboratory were selected. Subjects with an initial AMERK titer <75 were considered to have a negative serostatus; those with ≥75 were deemed to be positive.9 Database lock was August 11, 2023.
Variables and outcomes
We considered several complementary time-to-event endpoints with distinct interpretations and clinical implications, each of which is characterized by a choice of time origin and event definition. RFS was calculated as the time from the date of completion of the primary treatment to the earliest date of recurrent disease, with death viewed as a competing risk. EFS was calculated as the time from the date of initiation of primary treatment to the earliest recurrence, progression or death from any cause. MSS was calculated as the time from the date of diagnosis of MCC to death from MCC, with death from other causes viewed as a competing risk. OS was calculated as the time from the date of diagnosis of MCC to death from any cause. For each endpoint, subjects without the event at last known follow-up are censored. Clinical stage was determined via the 8th edition of the American Joint Committee on Cancer (AJCC) for MCC. Patients were considered “immunosuppressed” if they met any of the following criteria: had a history of a hematological malignancy; were on an immunosuppressive therapy at the time of MCC diagnosis, had a history of congenital immunosuppression or were HIV positive at the time of diagnosis. Initial treatment strategy was categorized into the following levels: surgery alone, surgical excision plus adjuvant radiation, primary-definitive radiation, chemotherapy, and immunotherapy.
Statistical methods
For descriptive statistics, 95% confidence intervals (CI) were generated using the bootstrap method for continuous data and Clopper-Pearson method for proportional data. Cumulative incidences of each time-to-event endpoint were estimated using the Aalen-Johansen method, stratified by AMERK serostatus. The association between baseline AMERK serostatus and RFS and MSS were assessed with Fine-Gray subdistribution hazard regression for competing risks. Cox proportional hazards regression was used to evaluate the association between serostatus and EFS as well as OS. The additional model parameters of sex, age, clinical stage, immunocompromised status, baseline performance status and initial treatment strategy were selected based on clinical relevance. Schoenfeld’s test was used to evaluate the proportional hazard assumption. The association between tumor burden and the initial AMERK titer was made with one-way ANOVA on ranks (a.k.a, Kruskal-Wallis test). To address minor data missingness due to limited availability of historical data, we performed a complete case analysis, along with a planned sensitivity analysis using multiple imputation by chained equations (MICE). Other planned sensitivity analyses included excluding patients who had received systemic therapy, and excluding patients who had “borderline” initial AMERK values (between 75 and 150). Significance testing was performed to evaluate the relationship between effect size and variability in the data; however, a strict significance level was not drawn. The project utilizes the following software: R10, confintr11, dplyr12, gtsummary13, magrittr14, mice15, purrr16, readr17, splitstackshape18, stringr19, survival20,and tidyr21 for data analysis; ggplot222, gt23, and survminer24for data visualization; quarto25 and GPT-426 for manuscript preparation. GPT-4 was used solely to improve spelling, grammar, and general editing after the initial manuscript was drafted.
Results
Cohort Characteristics
Our study identified 531 patients diagnosed with MCC treated at BWH and MGH from 2015 to 2022 (Figure 1). Of these, 362 (68%) underwent testing for circulating MCPyV oncoprotein antibodies as part of their routine care, with an increasing annual testing frequency (Figure S1). Within this subset, 72.1% (261/362) had an initial AMERK test within 90 days of MCC diagnosis, revealing 49.4% (129/261) seropositive and 50.6% (132/261) seronegative. Demographic comparisons between seropositive and seronegative groups (Table 1) showed that seropositive patients were generally younger (mean age 70.2, 95% CI 68.2 - 72.1 vs. 75.8, 95% CI 73.9 - 77.5). Notably, seropositive patients had a higher incidence of primary lesions on the lower extremities (19.4%, 95% CI 13-27.3 vs. 7.6%, 95% CI 3.7-13.5) and buttocks (7.8%, 95% CI 3.8-13.8 vs. 0.8%, 95% CI 0-4.1), but a lower incidence on the head and neck (21.7%, 95% CI 14.9-29.8 vs. 52.3%, 95% CI 43.4-61). There were no clinically meaningful differences in baseline performance status or initial disease stage between the two groups.
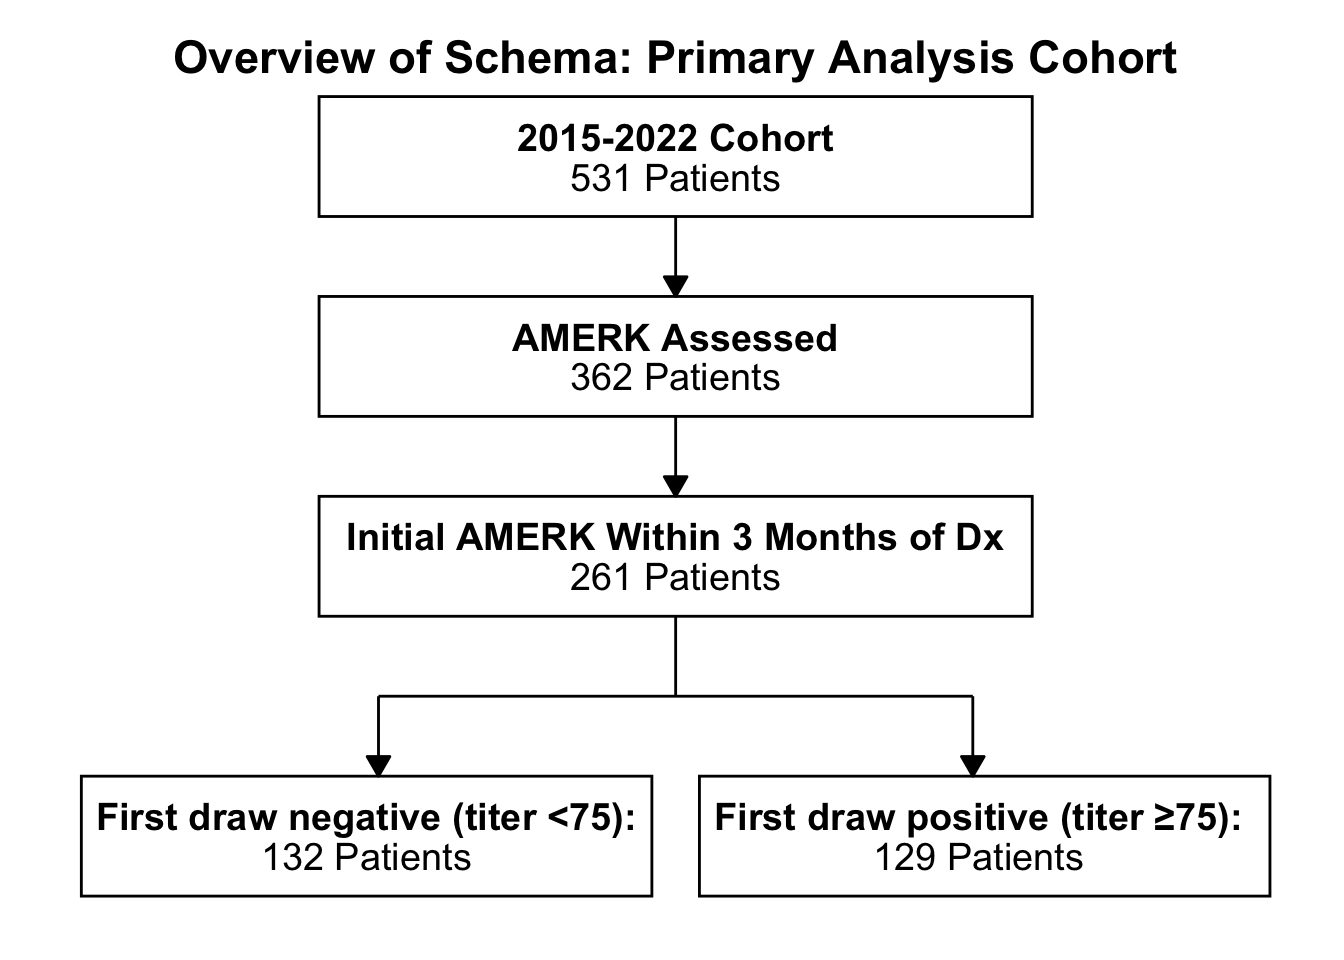
Figure 1. Patient Selection
Figure 1. Subject selection. Flow diagram of the primary analysis cohort studied at Brigham and Women’s Hospital/Dana-Farber Cancer Institute and Massachusetts General Hospital. Patients seen at these two medical centers were assessed for having had the AMERK test performed at any point in their disease journey (“AMERK Assessed”). That subset was analyzed for subjects that had an initial test within 90 days of the diagnoses of Merkel cell carcinoma (“Initial AMERK Within 3 Months of Dx”). These subjects were then stratified into those with an initial titer less than 75 (“seronegative”) and those greater than or equal to 75 (“seropositive”). Abbreviations: AMERK, anti-Merkel cell polyoma virus antibody test; Dx, initial diagnosis of Merkel cell carcinoma.
Figure S1. Subjects seen over time
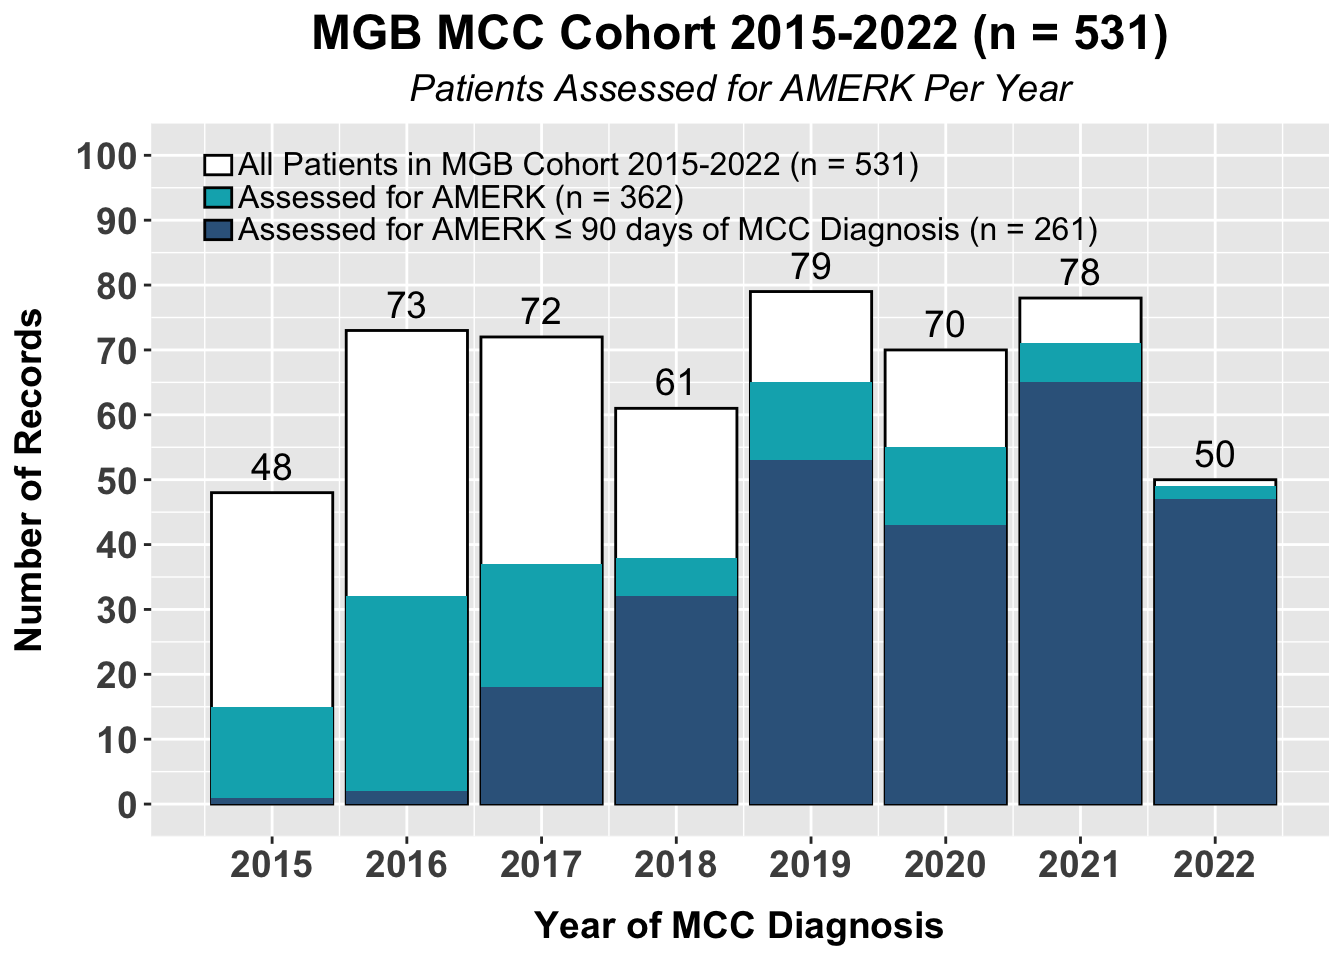
Figure S1. A bar plot of the total subjects with Merkel cell carcinoma seen at Brigham and Women’s Hospital/Dana-Farber Cancer Institute and Massachusetts General Hospital, stratified by year, if the AMERK test was assessed and whether or not the initial AMERK test was obtained with the first 90 days of diagnosis of Merkel cell carcinoma. The total number of patients diagnosed with Merkel cell carcinoma seen at the two institutions within the corresponding year is listed above each bar. Abbreviations: AMERK, anti-Merkel cell panel; MCC, Merkel cell carcinoma, MGB: Mass General Brigham.
Table 1. Patient Characteristics
| Characteristic | N | Overall, N = 2611 | 95% CI2 |
AMERK Status at Diagnosis
|
95% CI2 |
AMERK Status at Diagnosis
|
95% CI2 |
|---|---|---|---|---|---|---|---|
| Seronegative, N = 1321 | Seropositive, N = 1291 | ||||||
| Sex | 261 | ||||||
| Male | 161 (62%) | 55%, 68% | 85 (64%) | 56%, 72% | 76 (59%) | 50%, 67% | |
| Female | 100 (38%) | 32%, 45% | 47 (36%) | 28%, 44% | 53 (41%) | 33%, 50% | |
| Age | 261 | 74 (67, 80) | 76 (70, 82) | 74, 78 | 71 (63, 78) | 68, 72 | |
| Immune Suppressed | 261 | 42 (16%) | 12%, 21% | 26 (20%) | 13%, 28% | 16 (12%) | 7.5%, 20% |
| Primary Site | 261 | ||||||
| Head/Neck | 97 (37%) | 31%, 43% | 69 (52%) | 43%, 61% | 28 (22%) | 15%, 30% | |
| Upper Extremity | 54 (21%) | 16%, 26% | 20 (15%) | 9.7%, 23% | 34 (26%) | 19%, 35% | |
| Occult Primary | 40 (15%) | 11%, 20% | 17 (13%) | 7.9%, 20% | 23 (18%) | 12%, 26% | |
| Lower Extremity | 35 (13%) | 9.6%, 18% | 10 (7.6%) | 3.9%, 14% | 25 (19%) | 13%, 27% | |
| Trunk | 24 (9.2%) | 6.1%, 14% | 15 (11%) | 6.7%, 18% | 9 (7.0%) | 3.4%, 13% | |
| Buttocks | 11 (4.2%) | 2.2%, 7.6% | 1 (0.8%) | 0.04%, 4.8% | 10 (7.8%) | 4.0%, 14% | |
| Clinical Stage | 261 | ||||||
| I | 108 (41%) | 35%, 48% | 64 (48%) | 40%, 57% | 44 (34%) | 26%, 43% | |
| II | 49 (19%) | 14%, 24% | 19 (14%) | 9.1%, 22% | 30 (23%) | 16%, 32% | |
| III | 89 (34%) | 28%, 40% | 42 (32%) | 24%, 41% | 47 (36%) | 28%, 45% | |
| IV | 14 (5.4%) | 3.1%, 9.0% | 6 (4.5%) | 1.9%, 10% | 8 (6.2%) | 2.9%, 12% | |
| Not Clinically Staged | 1 (0.4%) | 0.02%, 2.5% | 1 (0.8%) | 0.04%, 4.8% | 0 (0%) | 0.00%, 3.6% | |
| Pathological Stage | 261 | ||||||
| I | 46 (18%) | 13%, 23% | 27 (20%) | 14%, 29% | 19 (15%) | 9.3%, 22% | |
| IIA | 9 (3.4%) | 1.7%, 6.7% | 2 (1.5%) | 0.26%, 5.9% | 7 (5.4%) | 2.4%, 11% | |
| IIB | 3 (1.1%) | 0.30%, 3.6% | 2 (1.5%) | 0.26%, 5.9% | 1 (0.8%) | 0.04%, 4.9% | |
| IIIA | 72 (28%) | 22%, 34% | 32 (24%) | 17%, 33% | 40 (31%) | 23%, 40% | |
| IIIB | 31 (12%) | 8.3%, 17% | 14 (11%) | 6.1%, 17% | 17 (13%) | 8.1%, 21% | |
| IV | 6 (2.3%) | 0.94%, 5.2% | 3 (2.3%) | 0.59%, 7.0% | 3 (2.3%) | 0.60%, 7.2% | |
| Not Pathologically Staged | 94 (36%) | 30%, 42% | 52 (39%) | 31%, 48% | 42 (33%) | 25%, 41% | |
| Baseline ECOG | 261 | ||||||
| 0 | 145 (56%) | 49%, 62% | 66 (50%) | 42%, 58% | 79 (61%) | 52%, 70% | |
| 1 | 67 (26%) | 21%, 31% | 36 (27%) | 20%, 36% | 31 (24%) | 17%, 33% | |
| 2 | 31 (12%) | 8.3%, 17% | 18 (14%) | 8.5%, 21% | 13 (10%) | 5.7%, 17% | |
| 3 | 12 (4.6%) | 2.5%, 8.1% | 7 (5.3%) | 2.3%, 11% | 5 (3.9%) | 1.4%, 9.3% | |
| 4 | 1 (0.4%) | 0.02%, 2.5% | 1 (0.8%) | 0.04%, 4.8% | 0 (0%) | 0.00%, 3.6% | |
| Not Reported | 5 (1.9%) | 0.71%, 4.7% | 4 (3.0%) | 0.98%, 8.1% | 1 (0.8%) | 0.04%, 4.9% | |
| 1 n (%); Median (IQR) | |||||||
| 2 CI = Confidence Interval | |||||||
Table 1. Patient characteristics. Abbreviations: ECOG, Eastern cooperative oncology group.
Association of MCPyV antibody serostatus and survival
Next, to evaluate the association between initial AMERK serostatus and survival, we developed regression models with four complementary survival endpoints as outcome measures: RFS, EFS, OS and MSS.
Recurrence-free survival
Among those classified as “no evidence of disease” (NED) following initial management (n = 239), we examined the association between AMERK serostatus and RFS, for comparison with previous findings of decreased recurrence hazard in seropositive patients.27 When death was treated as a competing risk, baseline seropositivity showed a lower cumulative incidence of recurrence over five years compared to seronegativity 27% (95% CI 19%- 36%) vs. 46% (95% CI 37%- 55%), (Figure 2). Controlling for sex, age, clinical stage, immune status, ECOG performance status, and initial treatment, seropositivity was associated with a reduced recurrence hazard (sub-distribution hazard ratio (SHR) = 0.48, 95% CI 0.3 - 0.78) (Table 2). This association between serostatus and RFS remained consistent across the planned sensitivity analyses (Tables S1-S3).
Lastly, for RFS we performed an additional sensitivity analysis aligning with the methods of Paulson et al.’s study, which used a Cox regression model and a different RFS definition. This analysis still demonstrated a decreased recurrence risk for initial positive AMERK (hazard ratio (HR) = 0.55, 95% CI 0.34 - 0.88; Table S4).
Figure 2. Cumulative incidence of recurrence
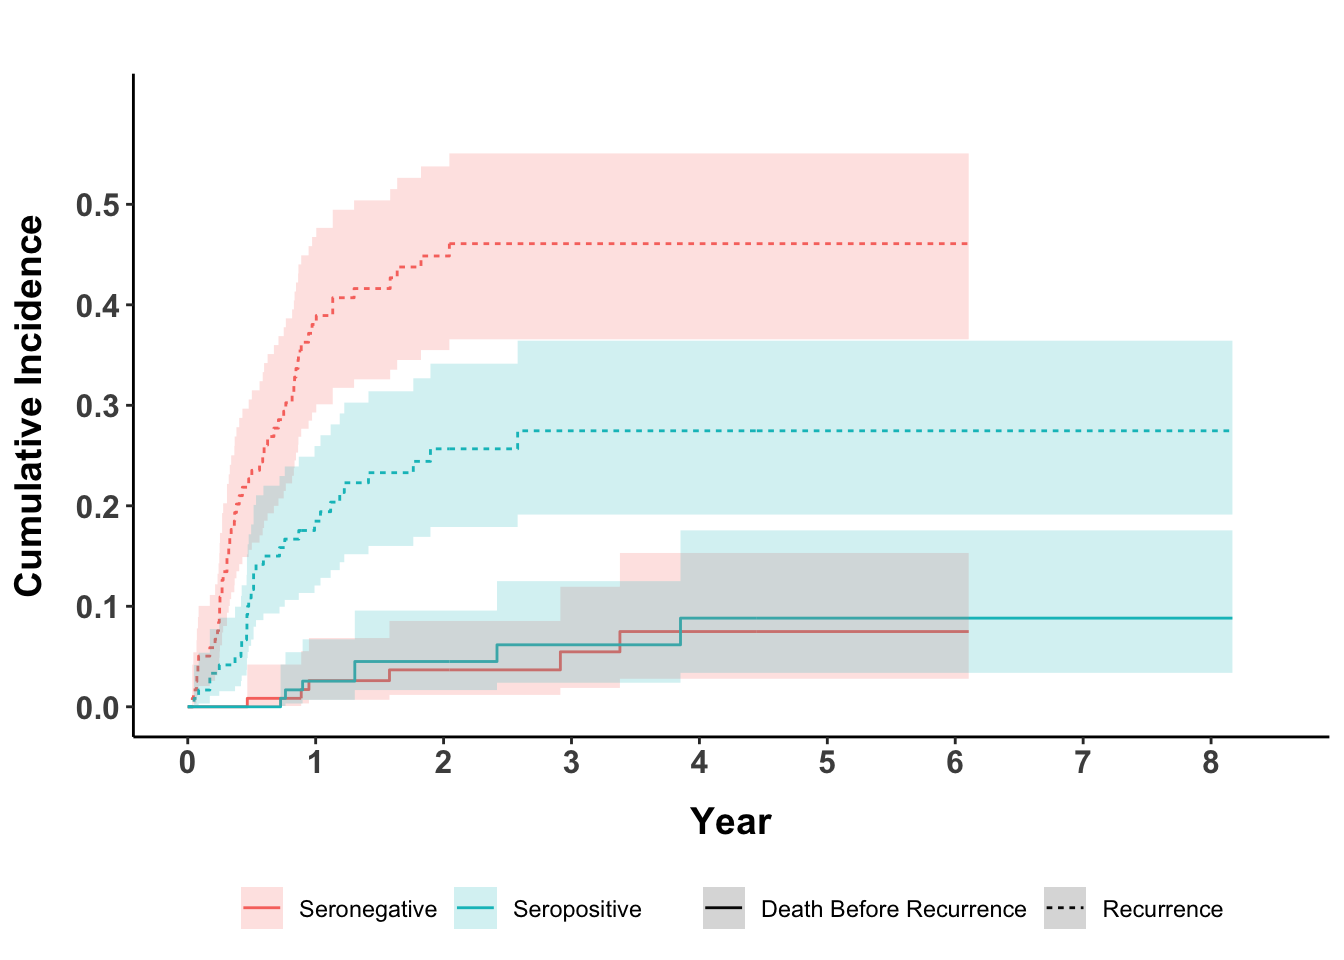
Figure 2. Cumulative incidence of recurrence. Patients rendered no evidence of disease after the initial management plan were followed for recurrence. Subjects are stratified by serostatus. Death before recurrence was treated as a competing risk.
Table 2. Subdistribution Hazard Regression for Recurrence-Free Survival
Complete Case Analysis
|
Univariable
|
Multivariable
|
||||
|---|---|---|---|---|---|---|
| Characteristic1 | N | SHR | 95% CI | SHR | 95% CI | p-value |
| Serostatus | ||||||
| Seronegative | 119 | — | — | — | — | |
| Seropositive | 120 | 0.49 | 0.31, 0.76 | 0.48 | 0.30, 0.78 | 0.003 |
| Sex | ||||||
| Female | 92 | — | — | — | — | |
| Male | 147 | 1.75 | 1.07, 2.85 | 1.54 | 0.92, 2.57 | 0.10 |
| Age | 239 | 1.03 | 1.01, 1.05 | 1.01 | 0.98, 1.04 | 0.5 |
| Clinical Stage | ||||||
| I | 105 | — | — | — | — | |
| IIA | 36 | 1.45 | 0.78, 2.71 | 1.94 | 0.99, 3.80 | 0.053 |
| IIB | 11 | 1.82 | 0.68, 4.89 | 1.82 | 0.65, 5.07 | 0.3 |
| III | 77 | 1.61 | 0.98, 2.65 | 1.80 | 1.00, 3.26 | 0.051 |
| IV | 10 | 0.68 | 0.17, 2.75 | 0.96 | 0.19, 4.92 | >0.9 |
| Immunocompromised | ||||||
| No | 201 | — | — | — | — | |
| Yes | 38 | 1.43 | 0.85, 2.42 | 1.21 | 0.67, 2.16 | 0.5 |
| Baseline ECOG | ||||||
| 0 | 141 | — | — | — | — | |
| 1 | 62 | 1.85 | 1.13, 3.02 | 1.69 | 1.00, 2.85 | 0.049 |
| 2-4 | 36 | 2.44 | 1.39, 4.30 | 1.56 | 0.76, 3.20 | 0.2 |
| Initial Treatment | ||||||
| Surgery Alone | 30 | — | — | — | — | |
| Surgical Excision, Adjuvant Radiation | 126 | 0.58 | 0.30, 1.10 | 0.66 | 0.35, 1.25 | 0.2 |
| Primary-Definitive Radiation | 41 | 1.47 | 0.72, 3.00 | 1.25 | 0.57, 2.75 | 0.6 |
| Chemotherapy | 4 | 1.05 | 0.28, 4.02 | 0.86 | 0.26, 2.78 | 0.8 |
| Immunotherapy | 38 | 0.59 | 0.27, 1.31 | 0.50 | 0.21, 1.17 | 0.11 |
| 1 Observations: 239, Events: 83, DoF: 14, EPDF: 5.9 | ||||||
Table 2. Merkel cell carcinoma recurrence-free survival and MCPyV oncoprotein serostatus at diagnosis. Patients rendered no evidence of disease after the initial management plan were followed for recurrence. A competing risk regression model was fitted with death before recurrence treated as a competing risk. Abbreviations: CI, confidence interval; DoF, degrees of freedom; ECOG, Eastern cooperative oncology group; EPDF, events per degree of freedom; SHR, subdistribution hazard ratio.
Supplemental Tables 1-4
Table S1. Sensitivity analysis of serostatus and RFS: excluding subjects with bordeline AMERK titers
No Borderline AMERK
|
Univariable
|
Multivariable
|
||||
|---|---|---|---|---|---|---|
| Characteristic1 | N | SHR | 95% CI | SHR | 95% CI | p-value |
| Serostatus | ||||||
| Seronegative | 119 | — | — | — | — | |
| Seropositive | 106 | 0.48 | 0.30, 0.76 | 0.46 | 0.28, 0.76 | 0.002 |
| Sex | ||||||
| Female | 86 | — | — | — | — | |
| Male | 139 | 1.73 | 1.05, 2.85 | 1.51 | 0.89, 2.55 | 0.13 |
| Age | 225 | 1.03 | 1.01, 1.06 | 1.01 | 0.98, 1.04 | 0.5 |
| Clinical Stage | ||||||
| I | 97 | — | — | — | — | |
| IIA | 34 | 1.56 | 0.83, 2.91 | 2.28 | 1.15, 4.52 | 0.018 |
| IIB | 9 | 2.40 | 0.89, 6.46 | 2.25 | 0.78, 6.46 | 0.13 |
| III | 76 | 1.56 | 0.94, 2.60 | 1.83 | 0.99, 3.39 | 0.054 |
| IV | 9 | 0.38 | 0.05, 3.11 | 0.52 | 0.05, 4.93 | 0.6 |
| Immunocompromised | ||||||
| No | 191 | — | — | — | — | |
| Yes | 34 | 1.57 | 0.91, 2.69 | 1.33 | 0.74, 2.42 | 0.3 |
| Baseline ECOG | ||||||
| 0 | 133 | — | — | — | — | |
| 1 | 57 | 2.19 | 1.33, 3.60 | 1.97 | 1.14, 3.39 | 0.015 |
| 2-4 | 35 | 2.64 | 1.48, 4.69 | 1.63 | 0.77, 3.47 | 0.2 |
| Initial Treatment | ||||||
| Surgery Alone | 30 | — | — | — | — | |
| Surgical Excision, Adjuvant Radiation | 115 | 0.59 | 0.31, 1.13 | 0.67 | 0.35, 1.27 | 0.2 |
| Primary-Definitive Radiation | 40 | 1.44 | 0.70, 2.95 | 1.20 | 0.54, 2.65 | 0.7 |
| Chemotherapy | 4 | 1.05 | 0.28, 3.95 | 0.86 | 0.27, 2.73 | 0.8 |
| Immunotherapy | 36 | 0.57 | 0.25, 1.29 | 0.51 | 0.22, 1.22 | 0.13 |
| 1 Observations: 225, Events: 79, DoF: 14, EPDF: 5.6 | ||||||
Table S1. Merkel cell carcinoma recurrence-free survival and MCPyV oncoprotein serostatus at diagnosis. Patients rendered no evidence of disease after the initial management plan were followed for recurrence. Subjects with an initial AMERK titer between 75 and 150, reported as “borderline”, were excluded (n = 14). A competing risk regression model was fitted with death before recurrence treated as a competing risk. Abbreviations: CI, confidence interval; DoF, degrees of freedom; ECOG, Eastern cooperative oncology group; EPDF, events per degree of freedom; RFS, recurrence-free survival; SHR, subdistribution hazard ratio.
Table S2. Sensitivity analysis of serostatus and RFS: excluding subjects treated with systemic therapy
No Systemic Therapy
|
Univariable
|
Multivariable
|
||||
|---|---|---|---|---|---|---|
| Characteristic1 | N | SHR | 95% CI | SHR | 95% CI | p-value |
| Serostatus | ||||||
| Seronegative | 96 | — | — | — | — | |
| Seropositive | 101 | 0.41 | 0.25, 0.67 | 0.41 | 0.24, 0.68 | <0.001 |
| Sex | ||||||
| Female | 84 | — | — | — | — | |
| Male | 113 | 1.60 | 0.97, 2.64 | 1.32 | 0.77, 2.25 | 0.3 |
| Age | 197 | 1.03 | 1.01, 1.06 | 1.01 | 0.99, 1.04 | 0.4 |
| Clinical Stage | ||||||
| I | 100 | — | — | — | — | |
| IIA | 34 | 1.52 | 0.82, 2.83 | 2.05 | 1.05, 4.02 | 0.036 |
| IIB | 11 | 1.78 | 0.67, 4.73 | 1.76 | 0.65, 4.79 | 0.3 |
| III | 51 | 1.67 | 0.95, 2.91 | 1.71 | 0.89, 3.26 | 0.11 |
| IV | 1 | 0.00 | 0.00, 0.00 | 0.00 | 0.00, 0.00 | <0.001 |
| Immunocompromised | ||||||
| No | 166 | — | — | — | — | |
| Yes | 31 | 1.44 | 0.80, 2.59 | 1.09 | 0.58, 2.06 | 0.8 |
| Baseline ECOG | ||||||
| 0 | 116 | — | — | — | — | |
| 1 | 47 | 1.55 | 0.89, 2.72 | 1.40 | 0.77, 2.56 | 0.3 |
| 2-4 | 34 | 2.42 | 1.37, 4.29 | 1.57 | 0.77, 3.20 | 0.2 |
| Initial Treatment | ||||||
| Surgery Alone | 30 | — | — | — | — | |
| Surgical Excision, Adjuvant Radiation | 126 | 0.57 | 0.31, 1.08 | 0.69 | 0.37, 1.30 | 0.3 |
| Primary-Definitive Radiation | 41 | 1.45 | 0.72, 2.92 | 1.31 | 0.60, 2.84 | 0.5 |
| 1 Observations: 197, Events: 70, DoF: 12, EPDF: 5.8 | ||||||
Table S2. Merkel cell carcinoma recurrence-free survival and MCPyV oncoprotein serostatus at diagnosis. Patients rendered no evidence of disease after the initial management plan were followed for recurrence. Subjects treated with systemic therapy (e.g. chemotherapy or immunotherapy) as part of the initial management plan were excluded (n = 42). A competing risk regression model was fitted with death before recurrence treated as a competing risk. Abbreviations: CI, confidence interval; DoF, degrees of freedom; ECOG, Eastern cooperative oncology group; EPDF, events per degree of freedom; RFS, recurrence-free survival; SHR, subdistribution hazard ratio.
Table S3. Sensitivity analysis of serostatus and RFS: utilizing multiple imputation
Multiple Imputation
|
Univariable
|
Multivariable
|
||||
|---|---|---|---|---|---|---|
| Characteristic1 | N | HR | 95% CI | HR | 95% CI | p-value |
| Serostatus | ||||||
| Seronegative | 125 | — | — | — | — | |
| Seropositive | 122 | 0.52 | 0.33, 0.81 | 0.53 | 0.32, 0.86 | 0.011 |
| Sex | ||||||
| Female | 94 | — | — | — | — | |
| Male | 153 | 1.84 | 1.13, 3.00 | 1.65 | 0.98, 2.76 | 0.059 |
| Age | 247 | 1.03 | 1.01, 1.05 | 1.01 | 0.99, 1.04 | 0.3 |
| Clinical Stage | ||||||
| I | 108 | — | — | — | — | |
| IIA | 37 | 1.57 | 0.83, 2.95 | 2.04 | 1.02, 4.08 | 0.043 |
| IIB | 12 | 1.66 | 0.63, 4.34 | 1.60 | 0.60, 4.29 | 0.3 |
| III | 80 | 1.65 | 1.00, 2.75 | 1.77 | 0.99, 3.14 | 0.052 |
| IV | 10 | 0.67 | 0.16, 2.89 | 0.90 | 0.18, 4.62 | >0.9 |
| Immunocompromised | ||||||
| No | 209 | — | — | — | — | |
| Yes | 38 | 1.42 | 0.82, 2.44 | 1.14 | 0.64, 2.04 | 0.7 |
| Baseline ECOG | ||||||
| 0 | 146 | — | — | — | — | |
| 1 | 65 | 1.85 | 1.12, 3.05 | 1.66 | 0.98, 2.82 | 0.058 |
| 2 | 26 | 2.80 | 1.49, 5.25 | 1.62 | 0.77, 3.41 | 0.2 |
| 3 | 10 | 1.58 | 0.55, 4.55 | 0.99 | 0.31, 3.18 | >0.9 |
| Initial Treatment | ||||||
| Surgery Alone | 32 | — | — | — | — | |
| Surgical Excision, Adjuvant Radiation | 128 | 0.63 | 0.33, 1.20 | 0.71 | 0.35, 1.42 | 0.3 |
| Primary-Definitive Radiation | 42 | 1.64 | 0.82, 3.29 | 1.43 | 0.67, 3.08 | 0.4 |
| Chemotherapy | 4 | 1.11 | 0.24, 5.04 | 0.91 | 0.19, 4.31 | >0.9 |
| Immunotherapy | 41 | 0.64 | 0.29, 1.45 | 0.54 | 0.21, 1.38 | 0.2 |
| 1 Observations: 247, Events: 84, DoF: 15, EPV: 5.6 | ||||||
Table S3. Merkel cell carcinoma recurrence-free survival and MCPyV oncoprotein serostatus at diagnosis. Patients rendered no evidence of disease after the initial management plan were followed for recurrence. A Cox regression model was fit. Multiple imputation by chained events was used to impute missing data. Abbreviations: CI, confidence interval; DoF, degrees of freedom; ECOG, Eastern cooperative oncology group; EPDF, events per degree of freedom; RFS, recurrence-free survival; SHR, subdistribution hazard ratio.
Table S4. Sensitivity analysis of serostatus and RFS: aligning model with Paulson et al.
Complete Case Analysis
|
Univariable
|
Multivariable
|
||||
|---|---|---|---|---|---|---|
| Characteristic1 | N | HR | 95% CI | HR | 95% CI | p-value |
| Serostatus | 0.012 | |||||
| Seronegative | 123 | — | — | — | — | |
| Seropositive | 121 | 0.52 | 0.33, 0.81 | 0.55 | 0.34, 0.88 | |
| Age | 244 | 1.03 | 1.01, 1.05 | 1.03 | 1.00, 1.05 | 0.020 |
| Sex | 0.069 | |||||
| Female | 94 | — | — | — | — | |
| Male | 150 | 1.80 | 1.12, 2.91 | 1.57 | 0.95, 2.58 | |
| Clinical Stage | 0.061 | |||||
| I | 107 | — | — | — | — | |
| IIA | 37 | 1.56 | 0.84, 2.91 | 1.96 | 1.02, 3.76 | |
| IIB | 12 | 1.62 | 0.63, 4.17 | 1.73 | 0.66, 4.50 | |
| III | 78 | 1.62 | 0.99, 2.67 | 1.83 | 1.10, 3.05 | |
| IV | 10 | 0.68 | 0.16, 2.84 | 0.61 | 0.15, 2.58 | |
| Immune Suppressed | 0.4 | |||||
| No | 206 | — | — | — | — | |
| Yes | 38 | 1.45 | 0.85, 2.47 | 1.28 | 0.74, 2.22 | |
| 1 Observations: 244, Events: 84, DoF: 8, EPV: 10.5 | ||||||
Table S4. Merkel cell carcinoma recurrence-free survival and MCPyV oncoprotein serostatus at diagnosis. Patients rendered no evidence of disease after the initial management plan were followed for recurrence. A Cox regression model was fit to evaluate the association of initial serostatus and RFS, controlling for sex, age, immune status and initial clinical stage. RFS was defined as the interval from the time of MCC diagnosis to date of first recurrence. Abbreviations: CI, confidence interval; DoF, degrees of freedom; ECOG, Eastern cooperative oncology group; EPDF, events per degree of freedom; RFS, recurrence-free survival; SHR, subdistribution hazard ratio.
Event-free survival
In the entire cohort, we next evaluated the impact of serostatus on EFS from start of initial treatment. Consistent with the RFS findings, initial seropositivity correlated with a decreased hazard for recurrence, progression, or death from any cause (HR = 0.58 95% CI 0.38 - 0.87) (Table 3). This association between serostatus and EFS remained consistent across sensitivity analyses (Table S5-S7).
Table 3. Event-free survival and MCPyV oncoprotein serostatus at diagnosis
Complete Case Analysis
|
Univariable
|
Multivariable
|
||||
|---|---|---|---|---|---|---|
| Characteristic1 | N | HR | 95% CI | HR | 95% CI | p-value |
| Serostatus | 0.008 | |||||
| Seronegative | 127 | — | — | — | — | |
| Seropositive | 128 | 0.56 | 0.39, 0.83 | 0.58 | 0.38, 0.87 | |
| Age | 255 | 1.04 | 1.02, 1.06 | 1.02 | 1.0, 1.04 | 0.13 |
| Sex | 0.037 | |||||
| Female | 98 | — | — | — | — | |
| Male | 157 | 1.77 | 1.17, 2.69 | 1.57 | 1.02, 2.41 | |
| Clinical Stage | 0.027 | |||||
| I | 106 | — | — | — | — | |
| IIA | 36 | 1.49 | 0.84, 2.66 | 2.09 | 1.12, 3.88 | |
| IIB | 11 | 1.45 | 0.57, 3.71 | 1.39 | 0.53, 3.64 | |
| III | 88 | 1.89 | 1.22, 2.93 | 2.16 | 1.30, 3.59 | |
| IV | 14 | 1.93 | 0.86, 4.33 | 2.30 | 0.85, 6.25 | |
| Immune Suppressed | 0.8 | |||||
| No | 213 | — | — | — | — | |
| Yes | 42 | 1.33 | 0.83, 2.12 | 1.06 | 0.65, 1.74 | |
| Baseline ECOG | 0.021 | |||||
| 0 | 145 | — | — | — | — | |
| 1 | 66 | 1.95 | 1.26, 3.02 | 1.78 | 1.13, 2.81 | |
| 2-4 | 44 | 3.02 | 1.89, 4.81 | 1.83 | 1.05, 3.19 | |
| Initial Treatment | 0.038 | |||||
| Surgery Alone | 33 | — | — | — | — | |
| Surgical Excision, Adjuvant Radiation | 126 | 0.45 | 0.26, 0.78 | 0.48 | 0.26, 0.88 | |
| Primary-Definitive Radiation | 46 | 1.36 | 0.76, 2.43 | 0.97 | 0.51, 1.85 | |
| Chemotherapy | 4 | 0.71 | 0.16, 3.06 | 0.50 | 0.11, 2.24 | |
| Immunotherapy | 45 | 0.81 | 0.43, 1.53 | 0.49 | 0.23, 1.07 | |
| Hospice | 1 | 3.88 | 0.51, 29.5 | 3.80 | 0.46, 31.1 | |
| 1 Observations: 255, Events: 111, DoF: 15, EPDF: 7.4, AIC: 1126.6 | ||||||
Table 3. Event-free survival and MCPyV oncoprotein serostatus at diagnosis. Subjects were followed for recurrence, disease progression or death from any cause. A Cox regression model was fit. Abbreviations: AIC, Akaike Information Criterion; CI, confidence interval; DoF, degrees of freedom; ECOG, Eastern cooperative oncology group; EPDF, events per degree of freedom; HR, hazard ratio
Supplemental Tables S5-S7
Table S5. Sensitivity analysis of serostatus and EFS: excluding subjects with bordeline AMERK titers
No Borderline AMERK
|
Univariable
|
Multivariable
|
||||
|---|---|---|---|---|---|---|
| Characteristic1 | N | HR | 95% CI | HR | 95% CI | p-value |
| Serostatus | 0.008 | |||||
| Seronegative | 127 | — | — | — | — | |
| Seropositive | 113 | 0.56 | 0.38, 0.83 | 0.57 | 0.37, 0.87 | |
| Age | 240 | 1.04 | 1.02, 1.06 | 1.02 | 1.00, 1.04 | 0.11 |
| Sex | 0.045 | |||||
| Female | 92 | — | — | — | — | |
| Male | 148 | 1.74 | 1.14, 2.65 | 1.55 | 1.00, 2.41 | |
| Clinical Stage | 0.022 | |||||
| I | 97 | — | — | — | — | |
| IIA | 34 | 1.63 | 0.91, 2.93 | 2.38 | 1.27, 4.49 | |
| IIB | 9 | 1.93 | 0.75, 4.94 | 1.63 | 0.61, 4.31 | |
| III | 87 | 1.89 | 1.20, 2.96 | 2.18 | 1.29, 3.69 | |
| IV | 13 | 1.68 | 0.70, 4.01 | 1.93 | 0.67, 5.55 | |
| Immune Suppressed | 0.6 | |||||
| No | 202 | — | — | — | — | |
| Yes | 38 | 1.41 | 0.88, 2.28 | 1.15 | 0.69, 1.91 | |
| Baseline ECOG | 0.007 | |||||
| 0 | 137 | — | — | — | — | |
| 1 | 61 | 2.29 | 1.46, 3.57 | 2.02 | 1.27, 3.22 | |
| 2-4 | 42 | 3.17 | 1.96, 5.13 | 1.89 | 1.06, 3.36 | |
| Initial Treatment Summarized | 0.062 | |||||
| Surgery Alone | 33 | — | — | — | — | |
| Surgical Excision, Adjuvant Radiation | 115 | 0.46 | 0.26, 0.82 | 0.49 | 0.27, 0.90 | |
| Primary-Definitive Radiation | 45 | 1.35 | 0.75, 2.43 | 0.94 | 0.49, 1.80 | |
| Chemotherapy | 4 | 0.71 | 0.16, 3.06 | 0.50 | 0.11, 2.23 | |
| Immunotherapy | 43 | 0.80 | 0.42, 1.52 | 0.51 | 0.23, 1.11 | |
| 1 Observations: 240, Events: 106, DoF: 14, EPDF: 7.6, AIC: 1059.6 | ||||||
Table S5. Event-free survival and MCPyV oncoprotein serostatus at diagnosis. Subjects were followed for recurrence, disease progression or death from any cause. Subjects with an initial AMERK titer between 75 and 150, reported as “borderline”, were excluded. A Cox regression model was fit. Abbreviations: AIC, Akaike Information Criterion; CI, confidence interval; DoF, degrees of freedom; ECOG, Eastern cooperative oncology group; EFS, event-free survival; EPDF, events per degree of freedom, HR, hazard ratio.
Table S6. Sensitivity analysis of serostatus and EFS: excluding subjects treated with systemic therapy
No Systemic Therapy
|
Univariable
|
Multivariable
|
||||
|---|---|---|---|---|---|---|
| Characteristic1 | N | HR | 95% CI | HR | 95% CI | p-value |
| Serostatus | 0.003 | |||||
| Seronegative | 99 | — | — | — | — | |
| Seropositive | 107 | 0.51 | 0.34, 0.79 | 0.50 | 0.31, 0.79 | |
| Age | 206 | 1.04 | 1.01, 1.06 | 1.02 | 0.99, 1.04 | 0.2 |
| Sex | 0.058 | |||||
| Female | 87 | — | — | — | — | |
| Male | 119 | 1.72 | 1.10, 2.69 | 1.57 | 0.98, 2.52 | |
| Clinical Stage | 0.014 | |||||
| I | 101 | — | — | — | — | |
| IIA | 34 | 1.61 | 0.90, 2.89 | 2.44 | 1.29, 4.61 | |
| IIB | 11 | 1.47 | 0.57, 3.76 | 1.53 | 0.58, 4.05 | |
| III | 58 | 1.94 | 1.19, 3.17 | 2.11 | 1.21, 3.66 | |
| IV | 2 | 4.44 | 0.60, 32.7 | 10.3 | 1.26, 85.0 | |
| Immune Suppressed | 0.8 | |||||
| No | 172 | — | — | — | — | |
| Yes | 34 | 1.42 | 0.85, 2.39 | 1.08 | 0.62, 1.87 | |
| Baseline ECOG | 0.2 | |||||
| 0 | 117 | — | — | — | — | |
| 1 | 50 | 1.81 | 1.09, 3.00 | 1.66 | 0.97, 2.82 | |
| 2-4 | 39 | 2.82 | 1.69, 4.69 | 1.50 | 0.81, 2.76 | |
| Initial Treatment Summarized | 0.006 | |||||
| Surgery Alone | 33 | — | — | — | — | |
| Surgical Excision, Adjuvant Radiation | 126 | 0.44 | 0.25, 0.78 | 0.46 | 0.25, 0.85 | |
| Primary-Definitive Radiation | 46 | 1.35 | 0.75, 2.41 | 1.03 | 0.53, 1.98 | |
| Hospice | 1 | 3.95 | 0.52, 30.2 | 5.04 | 0.60, 42.2 | |
| 1 Observations: 206, Events: 88, DoF: 13, EPDF: 6.8, AIC: 852.2 | ||||||
Table S6. Event-free survival and MCPyV oncoprotein serostatus at diagnosis. Subjects were followed for recurrence, disease progression or death from any cause. Subjects treated with systemic therapy (e.g. chemotherapy or immunotherapy) were excluded. A Cox regression model was fit. AIC, Akaike Information Criterion; CI, confidence interval; DoF, degrees of freedom; ECOG, Eastern cooperative oncology group; EFS, event-free survival; EPDF, events per degree of freedom; HR, hazard ratio.
Table S7. Sensitivity analysis of serostatus and EFS: utilizing multiple imputation
Multiple Imputation
|
Univariable
|
Multivariable
|
|||||
|---|---|---|---|---|---|---|---|
| Characteristic1 | N | HR | 95% CI | N | HR | 95% CI | p-value |
| Serostatus | |||||||
| Seronegative | 132 | — | — | 132 | — | — | |
| Seropositive | 129 | 0.59 | 0.41, 0.87 | 129 | 0.61 | 0.40, 0.92 | 0.020 |
| Sex | |||||||
| Female | 100 | — | — | 100 | — | — | |
| Male | 161 | 1.83 | 1.20, 2.78 | 161 | 1.58 | 1.02, 2.45 | 0.042 |
| Age | 261 | 1.04 | 1.02, 1.06 | 261 | 1.02 | 0.99, 1.04 | 0.2 |
| Clinical Stage | |||||||
| I | 108 | — | — | 108 | — | — | |
| IIA | 37 | 1.57 | 0.88, 2.77 | 37 | 2.22 | 1.19, 4.15 | 0.013 |
| IIB | 12 | 1.30 | 0.50, 3.35 | 12 | 1.32 | 0.50, 3.51 | 0.6 |
| III | 90 | 1.90 | 1.22, 2.96 | 90 | 2.14 | 1.26, 3.62 | 0.005 |
| IV | 14 | 1.95 | 0.86, 4.41 | 14 | 2.50 | 0.89, 7.00 | 0.081 |
| Immunocompromised | |||||||
| No | 219 | — | — | 219 | — | — | |
| Yes | 42 | 1.34 | 0.84, 2.15 | 42 | 1.08 | 0.65, 1.79 | 0.8 |
| Baseline ECOG | |||||||
| 0 | 149 | — | — | 149 | — | — | |
| 1 | 68 | 2.00 | 1.29, 3.11 | 68 | 1.82 | 1.15, 2.89 | 0.011 |
| 2 | 31 | 3.18 | 1.88, 5.39 | 31 | 1.80 | 0.97, 3.34 | 0.063 |
| 3 | 12 | 2.27 | 0.99, 5.16 | 12 | 1.52 | 0.61, 3.79 | 0.4 |
| 4 | 1 | 26.1 | 3.32, 205 | 1 | 13.1 | 1.49, 115 | 0.021 |
| Initial Treatment | |||||||
| Surgery Alone | 35 | — | — | 35 | — | — | |
| Surgical Excision, Adjuvant Radiation | 128 | 0.49 | 0.28, 0.86 | 128 | 0.50 | 0.27, 0.93 | 0.028 |
| Primary-Definitive Radiation | 46 | 1.47 | 0.82, 2.66 | 46 | 1.05 | 0.54, 2.04 | 0.9 |
| Chemotherapy | 4 | 0.77 | 0.18, 3.37 | 4 | 0.52 | 0.11, 2.38 | 0.4 |
| Immunotherapy | 47 | 0.87 | 0.46, 1.65 | 47 | 0.47 | 0.21, 1.06 | 0.070 |
| Hospice | 1 | 4.35 | 0.62, 30.3 | 1 | 3.64 | 0.39, 33.6 | 0.2 |
| 1 Observations: 261, Events: 113, DoF: 17, EPDF: 7 | |||||||
Table S7. Event-free survival and MCPyV oncoprotein serostatus at diagnosis. Subjects were followed for recurrence, disease progression or death from any cause. A Cox regression model fit. Multiple imputation by chained events was used to impute missing data. Abbreviations: CI, confidence interval; DoF, degrees of freedom; ECOG, Eastern cooperative oncology group; EPDF, events per degree of freedom; HR, hazard ratio.
Overall survival
To isolate the association of serostatus on death from any cause, a multiple variable Cox proportional hazard model was developed. Similar to the association seen with RFS and EFS, subjects with a baseline positive AMERK test had a decreased hazard of death from any cause (HR = 0.62; Table 4). However, the confidence intervals around this point estimate were broad (95% CI 0.36 - 1.07), suggesting uncertainty in the exact magnitude of the effect. Across the planned sensitivity analyses, similar associations between serostatus and OS were estimated, again with confidence intervals containing the null (Tables S8-S10).
Notably, death events are relatively rare in this cohort (n=66), and therefore there may be less power to detect associations with overall survival relative to other surrogate endpoints presented, particularly for a multivariable model with relatively few events per variable. Thus, while these results suggest an association between positive serostatus and improved overall survival in the present cohort, the limited number of events restricts the generalizability of these conclusions.
Table 4. Cox Regression for Overall Survival
Complete Case Analysis
|
Univariable
|
Multivariable
|
||||
|---|---|---|---|---|---|---|
| Characteristic1 | N | HR | 95% CI | HR | 95% CI | p-value |
| Serostatus | 0.081 | |||||
| Seronegative | 127 | — | — | — | — | |
| Seropositive | 128 | 0.57 | 0.34, 0.93 | 0.62 | 0.36, 1.07 | |
| Age | 255 | 1.05 | 1.02, 1.08 | 1.01 | 0.98, 1.04 | 0.6 |
| Sex | 0.2 | |||||
| Female | 98 | — | — | — | — | |
| Male | 157 | 1.91 | 1.10, 3.32 | 1.45 | 0.81, 2.59 | |
| Clinical Stage | 0.070 | |||||
| I | 106 | — | — | — | — | |
| IIA | 36 | 1.84 | 0.85, 4.00 | 2.57 | 1.14, 5.79 | |
| IIB | 11 | 1.51 | 0.45, 5.14 | 1.16 | 0.33, 4.13 | |
| III | 88 | 2.32 | 1.29, 4.16 | 2.24 | 1.16, 4.34 | |
| IV | 14 | 2.43 | 0.90, 6.55 | 1.46 | 0.44, 4.82 | |
| Immune Suppressed | 0.5 | |||||
| No | 213 | — | — | — | — | |
| Yes | 42 | 1.54 | 0.87, 2.74 | 1.28 | 0.68, 2.38 | |
| Baseline ECOG | <0.001 | |||||
| 0 | 145 | — | — | — | — | |
| 1 | 66 | 2.68 | 1.48, 4.84 | 2.58 | 1.41, 4.71 | |
| 2-4 | 44 | 6.53 | 3.55, 12.0 | 5.25 | 2.50, 11.0 | |
| Initial Treatment | 0.009 | |||||
| Surgery Alone | 33 | — | — | — | — | |
| Surgical Excision, Adjuvant Radiation | 126 | 0.32 | 0.15, 0.68 | 0.37 | 0.16, 0.85 | |
| Primary-Definitive Radiation | 46 | 1.49 | 0.73, 3.07 | 1.04 | 0.46, 2.35 | |
| Chemotherapy | 4 | 0.49 | 0.06, 3.82 | 0.51 | 0.06, 4.10 | |
| Immunotherapy | 45 | 1.23 | 0.59, 2.59 | 1.21 | 0.50, 2.93 | |
| Hospice | 1 | 25.9 | 3.03, 222 | 20.2 | 2.11, 194 | |
| 1 Observations: 255, Events: 66, DoF: 15, EPDF: 4.4, AIC: 628.9 | ||||||
Table 4. Overall survival and MCPyV oncoprotein serostatus at diagnosis. Subjects were followed for death from any cause. A Cox regression model was fit. Abbreviations: Abbreviations: AIC, Akaike Information Criterion; CI, confidence interval; ECOG, Eastern cooperative oncology group; HR, hazard ratio
Supplemental Tables 8-10
Table S8. Sensitivity analysis of serostatus and OS: excluding subjects with borderline AMERK titers
No Borderline AMERK
|
Univariable
|
Multivariable
|
||||
|---|---|---|---|---|---|---|
| Characteristic1 | N | HR | 95% CI | HR | 95% CI | p-value |
| Serostatus | 0.2 | |||||
| Seronegative | 127 | — | — | — | — | |
| Seropositive | 113 | 0.61 | 0.37, 1.01 | 0.68 | 0.39, 1.19 | |
| Age | 240 | 1.05 | 1.02, 1.07 | 1.01 | 0.98, 1.04 | 0.6 |
| Sex | 0.2 | |||||
| Female | 92 | — | — | — | — | |
| Male | 148 | 1.88 | 1.08, 3.28 | 1.51 | 0.84, 2.70 | |
| Clinical Stage | 0.11 | |||||
| I | 97 | — | — | — | — | |
| IIA | 34 | 1.99 | 0.91, 4.35 | 2.60 | 1.15, 5.87 | |
| IIB | 9 | 1.91 | 0.56, 6.52 | 1.20 | 0.34, 4.27 | |
| III | 87 | 2.35 | 1.29, 4.26 | 2.09 | 1.07, 4.11 | |
| IV | 13 | 2.75 | 1.01, 7.46 | 1.39 | 0.42, 4.63 | |
| Immune Suppressed | 0.3 | |||||
| No | 202 | — | — | — | — | |
| Yes | 38 | 1.77 | 0.99, 3.15 | 1.39 | 0.75, 2.61 | |
| Baseline ECOG | <0.001 | |||||
| 0 | 137 | — | — | — | — | |
| 1 | 61 | 2.84 | 1.57, 5.14 | 2.64 | 1.44, 4.85 | |
| 2-4 | 42 | 6.08 | 3.28, 11.3 | 4.97 | 2.35, 10.5 | |
| Initial Treatment Summarized | 0.029 | |||||
| Surgery Alone | 33 | — | — | — | — | |
| Surgical Excision, Adjuvant Radiation | 115 | 0.35 | 0.16, 0.74 | 0.39 | 0.17, 0.88 | |
| Primary-Definitive Radiation | 45 | 1.54 | 0.75, 3.17 | 1.04 | 0.46, 2.36 | |
| Chemotherapy | 4 | 0.49 | 0.06, 3.82 | 0.49 | 0.06, 3.98 | |
| Immunotherapy | 43 | 1.34 | 0.64, 2.81 | 1.26 | 0.52, 3.09 | |
| 1 Observations: 240, Events: 65, DoF: 14, EPDF: 4.64 | ||||||
Table S8. Overall survival and MCPyV oncoprotein serostatus at diagnosis. Subjects were followed for death from any cause. Subjects with an initial AMERK titer between 75 and 150, reported as “borderline”, were excluded. A Cox regression model was fit. CI, confidence interval; DoF, degrees of freedom; ECOG, Eastern cooperative oncology group; EPDF, events per degree of freedom; HR, hazard ratio; OS, overall survival.
Table S9. Sensitivity analysis of serostatus and OS: excluding subjects treated with systemic therapy
No Systemic Therapy
|
Univariable
|
Multivariable
|
||||
|---|---|---|---|---|---|---|
| Characteristic1 | N | HR | 95% CI | HR | 95% CI | p-value |
| Serostatus | 0.2 | |||||
| Seronegative | 99 | — | — | — | — | |
| Seropositive | 107 | 0.59 | 0.33, 1.05 | 0.64 | 0.34, 1.22 | |
| Age | 206 | 1.05 | 1.02, 1.08 | 1.02 | 0.99, 1.05 | 0.2 |
| Sex | 0.2 | |||||
| Female | 87 | — | — | — | — | |
| Male | 119 | 1.93 | 1.03, 3.60 | 1.55 | 0.80, 3.02 | |
| Clinical Stage | 0.040 | |||||
| I | 101 | — | — | — | — | |
| IIA | 34 | 2.00 | 0.92, 4.38 | 2.14 | 0.94, 4.88 | |
| IIB | 11 | 1.51 | 0.44, 5.14 | 1.00 | 0.28, 3.60 | |
| III | 58 | 1.82 | 0.93, 3.57 | 2.16 | 1.09, 4.31 | |
| IV | 2 | 32.5 | 3.90, 272 | 25.6 | 2.78, 236 | |
| Immune Suppressed | 0.3 | |||||
| No | 172 | — | — | — | — | |
| Yes | 34 | 2.06 | 1.09, 3.90 | 1.49 | 0.76, 2.91 | |
| Baseline ECOG | 0.002 | |||||
| 0 | 117 | — | — | — | — | |
| 1 | 50 | 2.16 | 1.05, 4.42 | 1.90 | 0.90, 3.98 | |
| 2-4 | 39 | 6.08 | 3.05, 12.1 | 4.31 | 1.89, 9.85 | |
| 1 Observations: 206, Events: 48, DoF: 10, EPDF: 4.8 | ||||||
Table S9. Overall survival and MCPyV oncoprotein serostatus at diagnosis. Subjects were followed for death from any cause. Subjects treated with systemic therapy (e.g. chemotherapy or immunotherapy) were excluded. A Cox regression model was fit. Abbreviations: CI, confidence interval; DoF, degrees of freedom; ECOG, Eastern cooperative oncology group; EPDF, events per degree of freedom; HR, hazard ratio; OS, overall survival.
Table S10. Sensitivity analysis of serostatus and OS: utilizing multiple imputation
Multiple Imputation
|
Univariable
|
Multivariable
|
||||
|---|---|---|---|---|---|---|
| Characteristic1 | N | HR | 95% CI | HR | 95% CI | p-value |
| Serostatus | ||||||
| Seronegative | 132 | — | — | — | — | |
| Seropositive | 129 | 0.57 | 0.34, 0.94 | 0.71 | 0.40, 1.25 | 0.2 |
| Sex | ||||||
| Female | 100 | — | — | — | — | |
| Male | 161 | 1.98 | 1.13, 3.47 | 1.26 | 0.71, 2.24 | 0.4 |
| Age | 261 | 1.05 | 1.02, 1.08 | 1.01 | 0.98, 1.03 | 0.5 |
| Clinical Stage | ||||||
| I | 108 | — | — | — | — | |
| IIA | 37 | 1.77 | 0.80, 3.89 | 1.96 | 0.84, 4.58 | 0.12 |
| IIB | 12 | 1.34 | 0.38, 4.66 | 0.81 | 0.24, 2.73 | 0.7 |
| III | 90 | 2.32 | 1.28, 4.22 | 1.86 | 0.92, 3.76 | 0.077 |
| IV | 14 | 2.42 | 0.88, 6.65 | 1.34 | 0.50, 3.63 | 0.6 |
| Immunocompromised | ||||||
| No | 219 | — | — | — | — | |
| Yes | 42 | 1.56 | 0.87, 2.80 | 1.24 | 0.68, 2.26 | 0.5 |
| Baseline ECOG | ||||||
| 0 | 149 | — | — | — | — | |
| 1 | 68 | 2.83 | 1.55, 5.15 | 2.00 | 0.92, 4.34 | 0.075 |
| 2 | 31 | 7.38 | 3.79, 14.4 | 5.64 | 1.21, 26.2 | 0.034 |
| 3 | 12 | 3.90 | 1.29, 11.8 | 2.43 | 0.63, 9.30 | 0.2 |
| 4 | 1 | 619 | 35.5, 10,778 | 0.01 | 0.00, Inf | >0.9 |
| Initial Treatment | ||||||
| Surgery Alone | 35 | — | — | — | — | |
| Surgical Excision, Adjuvant Radiation | 128 | 0.34 | 0.15, 0.73 | 0.54 | 0.26, 1.10 | 0.087 |
| Primary-Definitive Radiation | 46 | 1.60 | 0.77, 3.35 | 1.18 | 0.68, 2.05 | 0.5 |
| Chemotherapy | 4 | 0.53 | 0.07, 4.29 | 0.58 | 0.07, 5.02 | 0.6 |
| Immunotherapy | 47 | 1.34 | 0.63, 2.84 | 1.15 | 0.62, 2.16 | 0.6 |
| Hospice | 1 | 21.9 | 2.90, 165 | 12.7 | 1.78, 91.2 | 0.012 |
| 1 Observations: 261, Events: 67, DoF: 17, EPDF: 3.94 | ||||||
Table S10. Overall survival and MCPyV oncoprotein serostatus at diagnosis. Subjects were followed for death from any cause. Multiple imputation by chained events was used to impute missing data. A Cox regression model was fit. Abbreviations: CI, confidence interval; DoF, degrees of freedom; ECOG, Eastern cooperative oncology group; EPDF, events per degree of freedom; HR, hazard ratio; OS, overall survival.
Merkel cell carcinoma-specific survival
The advanced median age of 74 years and concurrent comorbidities in our cohort, with 43% having an ECOG performance status of ≥1, meant that only a subset of the overall deaths was attributed to MCC. When death from other causes was treated as a competing risk, the association of serostatus and MSS had an effect estimate commensurate with the other survival endpoints (SHR = 0.63); however, similar to the OS models, few MCC-specific death events (n = 43) resulted in substantial uncertainty in this model’s point estimate (95% CI 0.32 - 1.23) (Table 5). Sensitivity analyses yielded similar estimates and uncertainty (Tables S11-S13), indicating a need for caution when interpreting these findings.
Table 5. Subdistribution Hazard Regression for Merkel Cell Carcinoma-Specific Survival
Complete Case
|
Univariable
|
Multivariable
|
||||
|---|---|---|---|---|---|---|
| Characteristic1 | N | SHR | 95% CI | SHR | 95% CI | p-value |
| Serostatus | ||||||
| Seronegative | 120 | — | — | — | — | |
| Seropositive | 127 | 0.58 | 0.32, 1.07 | 0.63 | 0.32, 1.23 | 0.2 |
| Sex | ||||||
| Female | 94 | — | — | — | — | |
| Male | 153 | 2.13 | 1.04, 4.36 | 1.64 | 0.77, 3.46 | 0.2 |
| Age | 247 | 1.03 | 1.0, 1.06 | 1.00 | 0.97, 1.03 | 0.9 |
| Clinical Stage | ||||||
| I | 102 | — | — | — | — | |
| IIA | 35 | 1.37 | 0.42, 4.47 | 1.79 | 0.51, 6.24 | 0.4 |
| IIB | 11 | 2.00 | 0.44, 9.15 | 1.84 | 0.38, 8.94 | 0.5 |
| III | 85 | 3.53 | 1.64, 7.58 | 3.27 | 1.27, 8.40 | 0.014 |
| IV | 14 | 4.89 | 1.65, 14.5 | 2.77 | 0.66, 11.6 | 0.2 |
| Immunocompromised | ||||||
| No | 207 | — | — | — | — | |
| Yes | 40 | 1.61 | 0.79, 3.27 | 1.55 | 0.72, 3.33 | 0.3 |
| Baseline ECOG | ||||||
| 0 | 142 | — | — | — | — | |
| 1 | 63 | 2.43 | 1.24, 4.78 | 2.29 | 1.17, 4.46 | 0.015 |
| 2-4 | 42 | 3.29 | 1.51, 7.18 | 3.07 | 1.08, 8.70 | 0.035 |
| Initial Treatment | ||||||
| Surgery Alone | 31 | — | — | — | — | |
| Surgical Excision, Adjuvant Radiation | 125 | 0.36 | 0.13, 0.96 | 0.34 | 0.11, 1.03 | 0.056 |
| Primary-Definitive Radiation | 42 | 1.24 | 0.47, 3.28 | 0.70 | 0.20, 2.46 | 0.6 |
| Chemotherapy | 4 | 0.84 | 0.11, 6.57 | 0.60 | 0.14, 2.65 | 0.5 |
| Immunotherapy | 45 | 1.77 | 0.71, 4.44 | 0.96 | 0.30, 3.13 | >0.9 |
| 1 Observations: 247, Events: 43, DoF: 14, EPDF: 3.07 | ||||||
Table 5. Merkel cell carcinoma-specific survival and MCPyV oncoprotein serostatus at diagnosis. Subjects were followed for death from Merkel cell carcinoma. Abbreviations: CI, confidence interval; ECOG, Eastern cooperative oncology group; MSS, Merkel cell carcinoma-specific survival; SHR, subdistribution hazard ratio.
Supplemental Tables 11-13
Table S11. Sensitivity analysis of serostatus and MSS: excluding subjects with bordeline AMERK titers
No Borderline AMERK
|
Univariable
|
Multivariable
|
||||
|---|---|---|---|---|---|---|
| Characteristic1 | N | SHR | 95% CI | SHR | 95% CI | p-value |
| Serostatus | ||||||
| Seronegative | 120 | — | — | — | — | |
| Seropositive | 113 | 0.65 | 0.36, 1.19 | 0.69 | 0.36, 1.34 | 0.3 |
| Sex | ||||||
| Female | 88 | — | — | — | — | |
| Male | 145 | 2.13 | 1.04, 4.36 | 1.66 | 0.79, 3.49 | 0.2 |
| Age | 233 | 1.02 | 1.0, 1.06 | 1.00 | 0.97, 1.03 | 0.9 |
| Clinical Stage | ||||||
| I | 94 | — | — | — | — | |
| IIA | 33 | 1.38 | 0.42, 4.51 | 1.79 | 0.50, 6.42 | 0.4 |
| IIB | 9 | 2.37 | 0.52, 10.7 | 1.97 | 0.39, 9.97 | 0.4 |
| III | 84 | 3.37 | 1.57, 7.26 | 3.09 | 1.16, 8.24 | 0.024 |
| IV | 13 | 5.20 | 1.75, 15.4 | 2.73 | 0.64, 11.7 | 0.2 |
| Immunocompromised | ||||||
| No | 197 | — | — | — | — | |
| Yes | 36 | 1.79 | 0.88, 3.64 | 1.69 | 0.79, 3.61 | 0.2 |
| Baseline ECOG | ||||||
| 0 | 134 | — | — | — | — | |
| 1 | 58 | 2.55 | 1.30, 5.02 | 2.29 | 1.18, 4.45 | 0.014 |
| 2-4 | 41 | 3.16 | 1.44, 6.90 | 2.89 | 1.01, 8.30 | 0.049 |
| Initial Treatment | ||||||
| Surgery Alone | 31 | — | — | — | — | |
| Surgical Excision, Adjuvant Radiation | 114 | 0.39 | 0.14, 1.04 | 0.35 | 0.12, 1.05 | 0.061 |
| Primary-Definitive Radiation | 41 | 1.27 | 0.48, 3.37 | 0.69 | 0.19, 2.45 | 0.6 |
| Chemotherapy | 4 | 0.84 | 0.11, 6.58 | 0.60 | 0.13, 2.78 | 0.5 |
| Immunotherapy | 43 | 1.91 | 0.76, 4.79 | 1.00 | 0.30, 3.33 | >0.9 |
| 1 Observations: 233, Events: 43, DoF: 14, EPDF: 3.07 | ||||||
Table S11. Merkel cell carcinoma-specific survival and MCPyV oncoprotein serostatus at diagnosis. Subjects were followed for death from Merkel cell carcinoma. Subjects with an initial AMERK titer between 75 and 150, reported as “borderline”, were excluded. A competing risk regression model was fitted with death from any other cause treated as a competing risk. Abbreviations: CI, confidence interval; DoF, degrees of freedom; ECOG, Eastern cooperative oncology group; EPDF, events per degree of freedom; HR, hazard ratio, MSS, Merkel cell carcinoma-specific survival.
Table S12. Sensitivity analysis of serostatus and MSS: excluding subjects treated with systemic therapy
No Systemic Therapy
|
Univariable
|
Multivariable
|
||||
|---|---|---|---|---|---|---|
| Characteristic1 | N | SHR | 95% CI | SHR | 95% CI | p-value |
| Serostatus | ||||||
| Seronegative | 92 | — | — | — | — | |
| Seropositive | 106 | 0.57 | 0.27, 1.22 | 0.58 | 0.25, 1.36 | 0.2 |
| Sex | ||||||
| Female | 83 | — | — | — | — | |
| Male | 115 | 1.81 | 0.79, 4.14 | 1.46 | 0.60, 3.56 | 0.4 |
| Age | 198 | 1.02 | 0.99, 1.05 | 0.99 | 0.95, 1.03 | 0.6 |
| Clinical Stage | ||||||
| I | 97 | — | — | — | — | |
| IIA | 33 | 1.39 | 0.43, 4.49 | 1.79 | 0.49, 6.56 | 0.4 |
| IIB | 11 | 1.86 | 0.42, 8.29 | 1.58 | 0.33, 7.67 | 0.6 |
| III | 55 | 2.24 | 0.94, 5.32 | 2.30 | 0.75, 7.10 | 0.2 |
| IV | 2 | 49.3 | 4.11, 590 | 67.0 | 10.1, 444 | <0.001 |
| Immunocompromised | ||||||
| No | 166 | — | — | — | — | |
| Yes | 32 | 2.36 | 1.02, 5.45 | 2.06 | 0.89, 4.78 | 0.094 |
| Baseline ECOG | ||||||
| 0 | 114 | — | — | — | — | |
| 1 | 47 | 1.58 | 0.63, 3.98 | 1.38 | 0.52, 3.66 | 0.5 |
| 2-4 | 37 | 3.52 | 1.45, 8.52 | 2.43 | 0.70, 8.48 | 0.2 |
| Initial Treatment | ||||||
| Surgery Alone | 31 | — | — | — | — | |
| Surgical Excision, Adjuvant Radiation | 125 | 0.34 | 0.13, 0.92 | 0.30 | 0.10, 0.91 | 0.034 |
| Primary-Definitive Radiation | 42 | 1.16 | 0.44, 3.06 | 0.78 | 0.20, 3.01 | 0.7 |
| 1 Observations: 198, Events: 27, DoF: 12, EPDF: 2.25 | ||||||
Table S12. Merkel cell carcinoma-specific survival and MCPyV oncoprotein serostatus at diagnosis. Subjects were followed for death from Merkel cell carcinoma. Subjects treated with systemic therapy (e.g. Chemotherapy or Immunotherapy), were excluded. A competing risk regression model was fitted with death from any other cause treated as a competing risk. Abbreviations: CI, confidence interval; ECOG, Eastern cooperative oncology group; MSS, Merkel cell carcinoma-specific survival; HR, hazard ratio.
Table S13. Sensitivity analysis of serostatus and MSS: utilizing multiple imputation
Multiple Imputation
|
Univariable
|
Multivariable
|
||||
|---|---|---|---|---|---|---|
| Characteristic1 | N | SHR | 95% CI | SHR | 95% CI | p-value |
| Serostatus | ||||||
| Seronegative | 132 | — | — | — | — | |
| Seropositive | 129 | 0.55 | 0.29, 1.01 | 0.61 | 0.30, 1.24 | 0.2 |
| Sex | ||||||
| Female | 100 | — | — | — | — | |
| Male | 161 | 1.91 | 0.95, 3.86 | 1.37 | 0.65, 2.89 | 0.4 |
| Age | 261 | 1.04 | 1.00, 1.07 | 1.00 | 0.97, 1.04 | 0.9 |
| Clinical Stage | ||||||
| I | 108 | — | — | — | — | |
| IIA | 37 | 1.10 | 0.34, 3.57 | 1.61 | 0.46, 5.62 | 0.4 |
| IIB | 12 | 1.40 | 0.30, 6.61 | 1.32 | 0.26, 6.75 | 0.7 |
| III | 90 | 2.96 | 1.42, 6.17 | 2.68 | 1.15, 6.22 | 0.024 |
| IV | 14 | 3.80 | 1.28, 11.3 | 2.37 | 0.59, 9.48 | 0.2 |
| Immunocompromised | ||||||
| No | 219 | — | — | — | — | |
| Yes | 42 | 1.73 | 0.87, 3.45 | 1.55 | 0.70, 3.43 | 0.3 |
| Baseline ECOG | ||||||
| 0 | 149 | — | — | — | — | |
| 1 | 68 | 2.44 | 1.25, 4.78 | 2.33 | 1.17, 4.65 | 0.018 |
| 2 | 31 | 4.10 | 1.71, 9.79 | 3.16 | 1.11, 9.03 | 0.033 |
| 3 | 12 | 2.22 | 0.48, 10.1 | 2.20 | 0.42, 11.5 | 0.3 |
| 4 | 1 | |||||
| Initial Treatment | ||||||
| Surgery Alone | 35 | — | — | — | — | |
| Surgical Excision, Adjuvant Radiation | 128 | 0.38 | 0.15, 1.00 | 0.38 | 0.13, 1.11 | 0.076 |
| Primary-Definitive Radiation | 46 | 1.67 | 0.65, 4.30 | 1.04 | 0.36, 3.04 | >0.9 |
| Chemotherapy | 4 | 0.80 | 0.09, 6.97 | 0.63 | 0.07, 5.93 | 0.7 |
| Immunotherapy | 47 | 1.82 | 0.73, 4.56 | 1.05 | 0.34, 3.24 | >0.9 |
| Hospice | 1 | 0.00 | 0.00, Inf | 0.01 | 0.00, Inf | >0.9 |
| 1 Observations: 261, Events: 48, DoF: 17, EPDF: 2.82 | ||||||
Table S13. Merkel cell carcinoma-specific survival and MCPyV oncoprotein serostatus at diagnosis. Subjects were followed for death from Merkel cell carcinoma. Multiple imputation by chained events was used to impute missing data. A Cox regression model was fit. Abbreviations: CI, confidence interval; DoF, degrees of freedom; ECOG, Eastern cooperative oncology group; EPDF, events per degree of freedom; HR, hazard ratio; MSS, merkel cell carcinoma-specific survival.
Association of AMERK serostatus and survival, stratified by disease burden
Recognizing the link between initial AMERK serostatus and disease burden, we further investigated the potential modification of the relationship between serostatus and survival by the extent of disease at diagnosis. We stratified subjects based on serostatus and disease extent (skin-only/localized vs. metastatic). Notably, serostatus predicted improved survival only in patients with localized disease (Table 6). After adjusting for sex, age and baseline ECOG, seropositivity in these patients was associated with a marked decrease in the hazards for RFS (SHR = 0.25), EFS (HR = 0.33), OS (HR = 0.47), and MSS (SHR = 0.26). In contrast, that effect was absent in subjects with metastatic disease at initial diagnosis, as evidenced by hazard ratios for RFS (SHR = 1.3), EFS (HR = 1.14), OS (HR = 0.96), and MSS (SHR = 0.95). The survival benefit of seropositivity was evident in both clinical stages I and II, with a more pronounced effect in those with higher-risk primary tumors. For instance, seropositive stage II patients showed markedly lower 2-year cumulative incidences of recurrence, progression, death from any cause, and MCC-specific death compared to seronegative individuals. In contrast, for stage III and IV patients, the survival outcomes were similar irrespective of serostatus, as shown in Table S14.
Table 6. Regression Models for Serostatus and Survival Stratified By Disease Extent
| Regression Models for Serostatus and Survival Stratifed By Disease Extent | ||||||||||||
|---|---|---|---|---|---|---|---|---|---|---|---|---|
| Outcome | Disease Extent | Serostatus | N |
Univariable
|
Multivariable
|
Cumulative Incidence (95% CI)
|
||||||
| HR | 95% CI | p-value | HR | 95% CI | p-value | 1-year | 2-year | 5-year | ||||
| RFS | Localized | Negative | 80 | -- | -- | -- | -- | -- | -- | 42% (31, 52) | 47% (36, 58) | 49% (37, 60) |
| RFS | Localized | Positive | 72 | 0.25 | 0.13, 0.48 | 0.00004 | 0.25 | 0.12, 0.51 | 0.0001 | 9.9% (4.3, 18) | 16% (8.6, 26) | 16% (8.6, 26) |
| RFS | Metastatic | Negative | 39 | -- | -- | -- | -- | -- | -- | 31% (17, 46) | 40% (24, 55) | 40% (24, 55) |
| RFS | Metastatic | Positive | 48 | 1.07 | 0.55, 2.1 | 0.84 | 1.3 | 0.66, 2.58 | 0.45 | 31% (19, 45) | 41% (25, 55) | 47% (28, 63) |
| EFS | Localized | Negative | 80 | -- | -- | -- | -- | -- | -- | 43% (32, 53) | 51% (39, 62) | 55% (43, 66) |
| EFS | Localized | Positive | 73 | 0.32 | 0.18, 0.57 | 0.0001 | 0.33 | 0.18, 0.6 | 0.0003 | 14% (7.1, 23) | 22% (13, 32) | 24% (14, 35) |
| EFS | Metastatic | Negative | 47 | -- | -- | -- | -- | -- | -- | 45% (30, 58) | 52% (37, 66) | 57% (39, 72) |
| EFS | Metastatic | Positive | 55 | 0.95 | 0.55, 1.64 | 0.855 | 1.14 | 0.65, 2.01 | 0.642 | 44% (30, 56) | 51% (36, 64) | 59% (37, 76) |
| OS | Localized | Negative | 80 | -- | -- | -- | -- | -- | -- | 7.6% (3.1, 15) | 25% (15, 35) | 35% (22, 49) |
| OS | Localized | Positive | 73 | 0.42 | 0.19, 0.91 | 0.028 | 0.47 | 0.21, 1.05 | 0.065 | 4.2% (1.1, 11) | 9.0% (3.6, 17) | 18% (7.8, 31) |
| OS | Metastatic | Negative | 47 | -- | -- | -- | -- | -- | -- | 26% (14, 39) | 30% (18, 44) | 51% (30, 69) |
| OS | Metastatic | Positive | 55 | 0.66 | 0.34, 1.29 | 0.228 | 0.96 | 0.47, 1.97 | 0.911 | 7.5% (2.4, 17) | 24% (13, 37) | 55% (26, 77) |
| MSS | Localized | Negative | 76 | -- | -- | -- | -- | -- | -- | 5.3% (1.7, 12) | 16% (8.3, 25) | 20% (9.8, 33) |
| MSS | Localized | Positive | 72 | 0.25 | 0.07, 0.86 | 0.03 | 0.26 | 0.08, 0.87 | 0.03 | 0.00% (—, —) | 3.3% (0.61, 10) | 5.4% (1.4, 14) |
| MSS | Metastatic | Negative | 44 | -- | -- | -- | -- | -- | -- | 23% (12, 36) | 25% (13, 39) | 36% (20, 51) |
| MSS | Metastatic | Positive | 55 | 0.74 | 0.35, 1.54 | 0.42 | 0.95 | 0.43, 2.06 | 0.89 | 5.7% (1.5, 14) | 20% (9.6, 33) | 51% (23, 74) |
Table 6. Association of initial AMERK serostatus and survival, stratified by disease extent. Four outcomes are included: RFS, EFS, OS and MSS. Subjects were stratified on both serostatus (seropostive vs. seronegative) and disease extent at diagnosis (localized (i.e. clinical stage I or II) vs. metastatic (i.e. clinical stage III or IV)). For RFS and MSS competing risk regression models were fitted with death from any cause prior to recurrence and death from a non Merkel cell carcinoma-specific death treated as competing risks for each model, respectively. For EFS and OS a cox proportional hazard model was fit. All multivariable models were controlled for age, sex and baseline ECOG status. For the competing risk regression models, the hazard ratio in the table reflects the subdistribution hazard. Cumulative incidence values represent the incidence of the corresponding clinical outcome (e.g. RFS, EFS, OS, MSS). Abbreviations: CI, confidence interval; EFS, event-free survival; ECOG, Eastern cooperative oncology group; HR, hazard ratio; MCC, Merkel cell carcinoma; MSS, MCC-specific survival; OS, overall survival; RFS, recurrence-free survival.
Table S14. Regression models for serostatus and survival stratified by clinical stage
| Outcome | Stage | Serostatus | N |
Univariable
|
Multivariable
|
Cumulative Incidence (95% CI)
|
||||||
|---|---|---|---|---|---|---|---|---|---|---|---|---|
| HR | 95% CI | p-value | HR | 95% CI | p-value | 1-year | 2-year | 5-year | ||||
| RFS | Stage I | Negative | 62 | -- | -- | -- | -- | -- | -- | 16% (4.8, 33) | 20% (7.1, 38) | 26% (10, 46) |
| RFS | Stage I | Positive | 43 | 0.24 | 0.09, 0.62 | 0.003 | 0.28 | 0.1, 0.74 | 0.01 | 0.00% (—, —) | 0.00% (—, —) | 0.00% (—, —) |
| RFS | Stage II | Negative | 18 | -- | -- | -- | -- | -- | -- | 61% (34, 80) | 74% (43, 90) | 74% (43, 90) |
| RFS | Stage II | Positive | 29 | 0.16 | 0.06, 0.41 | 0.0001 | 0.19 | 0.08, 0.45 | 0.00022 | 14% (4.3, 29) | 21% (8.5, 38) | 21% (8.5, 38) |
| RFS | Stage III | Negative | 35 | -- | -- | -- | -- | -- | -- | 34% (19, 50) | 44% (27, 60) | 44% (27, 60) |
| RFS | Stage III | Positive | 42 | 0.96 | 0.48, 1.91 | 0.91 | 1.09 | 0.56, 2.12 | 0.81 | 33% (20, 48) | 44% (27, 60) | 44% (27, 60) |
| RFS | Stage IV | Negative | 4 | NA | NA | NA | NA | NA | NA | 0.00% (—, —) | 0.00% (—, —) | —% (—, —) |
| RFS | Stage IV | Positive | 6 | NA | NA | NA | NA | NA | NA | 17% (0.47, 55) | 17% (0.47, 55) | —% (—, —) |
| EFS | Stage I | Negative | 62 | -- | -- | -- | -- | -- | -- | 36% (24, 48) | 43% (30, 56) | 49% (34, 62) |
| EFS | Stage I | Positive | 44 | 0.34 | 0.15, 0.75 | 0.007 | 0.43 | 0.19, 0.98 | 0.044 | 14% (5.6, 26) | 19% (8.9, 33) | 19% (8.9, 33) |
| EFS | Stage II | Negative | 18 | -- | -- | -- | -- | -- | -- | 67% (39, 84) | 80% (48, 93) | 80% (48, 93) |
| EFS | Stage II | Positive | 29 | 0.18 | 0.07, 0.43 | 0.0001 | 0.19 | 0.08, 0.47 | 0.0003 | 14% (4.3, 29) | 25% (11, 43) | 31% (14, 49) |
| EFS | Stage III | Negative | 88 | -- | -- | -- | -- | -- | -- | 47% (31, 61) | 55% (38, 69) | 61% (41, 76) |
| EFS | Stage III | Positive | 47 | 0.86 | 0.48, 1.53 | 0.6066 | 1.14 | 0.62, 2.12 | 0.6671 | 43% (28, 56) | 48% (32, 61) | 58% (32, 77) |
| EFS | Stage IV | Negative | 14 | -- | -- | -- | -- | -- | -- | 33% (3.2, 70) | 33% (3.2, 70) | —% (—, —) |
| EFS | Stage IV | Positive | 8 | 1.69 | 0.32, 8.75 | 0.5346 | 1.63 | 0.31, 8.61 | 0.5648 | 53% (12, 83) | 69% (16, 93) | —% (—, —) |
| OS | Stage I | Negative | 62 | -- | -- | -- | -- | -- | -- | 8.1% (3.0, 17) | 16% (7.7, 27) | 29% (15, 45) |
| OS | Stage I | Positive | 44 | 0.53 | 0.19, 1.49 | 0.228 | 0.82 | 0.28, 2.42 | 0.725 | 6.9% (1.8, 17) | 9.7% (3.0, 21) | 13% (4.5, 26) |
| OS | Stage II | Negative | 18 | -- | -- | -- | -- | -- | -- | 5.9% (0.35, 24) | 56% (28, 77) | 56% (28, 77) |
| OS | Stage II | Positive | 29 | 0.18 | 0.05, 0.58 | 0.0045 | 0.14 | 0.04, 0.49 | 0.0024 | 0.00% (—, —) | 7.6% (1.3, 22) | 24% (5.7, 49) |
| OS | Stage III | Negative | 41 | -- | -- | -- | -- | -- | -- | 25% (13, 39) | 30% (16, 44) | 53% (30, 72) |
| OS | Stage III | Positive | 47 | 0.63 | 0.3, 1.3 | 0.2118 | 1.02 | 0.45, 2.3 | 0.966 | 8.7% (2.7, 19) | 23% (11, 37) | 54% (23, 77) |
| OS | Stage IV | Negative | 6 | -- | -- | -- | -- | -- | -- | 33% (3.4, 70) | 33% (3.4, 70) | —% (—, —) |
| OS | Stage IV | Positive | 8 | 0.86 | 0.14, 5.24 | 0.8713 | 0.82 | 0.13, 5.27 | 0.8364 | 0.00% (—, —) | 29% (3.1, 64) | —% (—, —) |
| MSS | Stage I | Negative | 59 | -- | -- | -- | -- | -- | -- | 6.8% (2.2, 15) | 11% (4.3, 21) | 16% (5.8, 30) |
| MSS | Stage I | Positive | 43 | 0.38 | 0.08, 1.71 | 0.21 | 0.46 | 0.1, 2.03 | 0.31 | 0.00% (—, —) | 2.8% (0.21, 13) | 6.1% (1.0, 18) |
| MSS | Stage II | Negative | 17 | -- | -- | -- | -- | -- | -- | 0.00% (—, —) | 33% (11, 57) | 33% (11, 57) |
| MSS | Stage II | Positive | 29 | 0.1 | 0.01, 0.8 | 0.03 | 0.08 | 0.01, 0.6 | 0.01 | 0.00% (—, —) | 3.7% (0.25, 16) | 3.7% (0.25, 16) |
| MSS | Stage III | Negative | 38 | -- | -- | -- | -- | -- | -- | 21% (9.8, 35) | 24% (12, 38) | 36% (19, 52) |
| MSS | Stage III | Positive | 47 | 0.71 | 0.31, 1.59 | 0.4 | 0.92 | 0.39, 2.18 | 0.85 | 6.6% (1.7, 16) | 18% (7.6, 32) | 49% (20, 74) |
| MSS | Stage IV | Negative | 6 | NA | NA | NA | NA | NA | NA | 33% (3.4, 70) | 33% (3.4, 70) | —% (—, —) |
| MSS | Stage IV | Positive | 8 | NA | NA | NA | NA | NA | NA | 0.00% (—, —) | 29% (3.1, 64) | —% (—, —) |
Table S14. Association of initial AMERK serostatus and survival, stratified by clinical stage. Four outcome measures are included: RFS, EFS, OS and MSS. Subjects were stratified on both serostatus (seropositive vs. seronegative) and on AJCC 8th edition clinical stage. For RFS and MSS competing risk regression models were fitted with death from any cause and death from a non Merkel cell carcinoma-specific death treated as competing risks for each model, respectively. For EFS and OS a cox proportional hazard model was fit. All multivariable models were controlled for age and sex. For the competing risk regression models, the hazard ratio in the table reflects the subdistribution hazard. Cumulative incidence values represent the incidence of the corresponding clinical outcome (e.g. RFS, EFS, OS, MSS). Abbreviations: CI, confidence interval; EFS, event-free survival; ECOG, Eastern cooperative oncology group; HR, hazard ratio; MSS, MCC-specific survival; OS, overall survival; RFS, recurrence-free survival.
Evaluation of Statistical Persuasiveness and Proportional Hazards Assumption.
In line with our pre-registered statistical analysis plan, we did not set a strict significance threshold for this exploratory study. However, to assess the likelihood that our results could occur by chance, we adjusted all statistical tests (totaling 63) for multiplicity. This was done using both the Benjamini-Hochberg procedure and the Bonferroni test, as detailed in Table S15. Additionally, we assessed the regression models for proportionality of hazards (Table S16). Significance tests for proportionality of the serostatus hazard ratio for the OS and MSS models yielded p-values below 0.05, however due to the rarity of these outcomes additional model complexities such as time-varying effects were not considered, meaning these particular estimates can be interpreted as averaging over a potentially time-varying association.
Table S15. Examining the effect of multiplicity on external validity
| Analysis Group | Original p-value | BH Adjusted p Value | Significant After BH Correction? | Bonferroni Adjusted p Value | Significant After Bonferroni Correction? |
|---|---|---|---|---|---|
| Assoc. Initial AMERK Titer & Localized-Metastatic | <0.00001 | <0.00001 | TRUE | <0.00001 | TRUE |
| Assoc. Initial AMERK Titer & Clinical Stage | <0.00001 | <0.00001 | TRUE | <0.00001 | TRUE |
| Assoc. Initial AMERK Titer & Greatest Nodal Stage | <0.00001 | <0.00001 | TRUE | <0.00001 | TRUE |
| Primary Site | <0.00001 | 0.00001 | TRUE | 0.00004 | TRUE |
| Assoc. Initial AMERK Titer & Tumor Stage | 0.00001 | 0.00012 | TRUE | 0.00059 | TRUE |
| Age | 0.00002 | 0.00019 | TRUE | 0.00114 | TRUE |
| Assoc. Initial AMERK Titer & Greatest Tumor Size | 0.00005 | 0.00046 | TRUE | 0.00319 | TRUE |
| RFS CRR Localized | 0.00010 | 0.00070 | TRUE | 0.00630 | TRUE |
| RFS CRR Serostatus | 0.00010 | 0.00070 | TRUE | 0.00630 | TRUE |
| RFS CRR Stage II | 0.00022 | 0.00139 | TRUE | 0.01386 | TRUE |
| EFS Cox PH Stage II | 0.00028 | 0.00157 | TRUE | 0.01786 | TRUE |
| EFS Cox PH Localized Disease | 0.00030 | 0.00157 | TRUE | 0.01890 | TRUE |
| RFS CRR No Systemic Therapy | 0.00056 | 0.00271 | TRUE | 0.03528 | TRUE |
| RFS Cox PH Stage II | 0.00075 | 0.00336 | TRUE | 0.04702 | TRUE |
| EFS Cox PH Serostatus | 0.00090 | 0.00378 | TRUE | 0.05670 | FALSE |
| RFS CRR Serostatus Continuous | 0.00100 | 0.00394 | TRUE | 0.06300 | FALSE |
| RFS CRR Serostatus Continuous | 0.00170 | 0.00630 | TRUE | 0.10710 | FALSE |
| EFS Cox PH Continous AMERK | 0.00182 | 0.00636 | TRUE | 0.11440 | FALSE |
| RFS CRR No Bordeline AMERK | 0.00230 | 0.00763 | TRUE | 0.14490 | FALSE |
| RFS CRR AMERK:dzExtent | 0.00300 | 0.00930 | TRUE | 0.18900 | FALSE |
| RFS CRR Complete Case | 0.00310 | 0.00930 | TRUE | 0.19530 | FALSE |
| EFS Cox PH No Systemic Therapy | 0.00337 | 0.00964 | TRUE | 0.21208 | FALSE |
| RFS Cox PH All Stages | 0.00380 | 0.01041 | TRUE | 0.23948 | FALSE |
| EFS Cox PH Continous AMERK:dzExtent | 0.00443 | 0.01139 | TRUE | 0.27906 | FALSE |
| RFS Cox PH Stage I | 0.00452 | 0.01139 | TRUE | 0.28480 | FALSE |
| OS Cox PH Stage II | 0.00700 | 0.01697 | TRUE | 0.44123 | FALSE |
| EFS Cox PH AMERK:dzExtent | 0.00780 | 0.01820 | TRUE | 0.49140 | FALSE |
| EFS Cox PH No Borderline AMERK | 0.00857 | 0.01921 | TRUE | 0.54002 | FALSE |
| EFS Cox PH All Stages | 0.00884 | 0.01921 | TRUE | 0.55723 | FALSE |
| RFS CRR Stage I | 0.01000 | 0.02100 | TRUE | 0.63000 | FALSE |
| RFS Cox PH Multiple Imputation | 0.01067 | 0.02169 | TRUE | 0.67246 | FALSE |
| MSS CRR Stage II | 0.01400 | 0.02756 | TRUE | 0.88200 | FALSE |
| EFS Cox PH Multiple Imputation | 0.02024 | 0.03864 | TRUE | 1.00000 | FALSE |
| MSS CRR Localized | 0.03000 | 0.05559 | FALSE | 1.00000 | FALSE |
| OS Cox PH All Stages | 0.03305 | 0.05949 | FALSE | 1.00000 | FALSE |
| EFS Cox PH Stage I | 0.04433 | 0.07758 | FALSE | 1.00000 | FALSE |
| OS Cox PH Localized Disease | 0.06500 | 0.11068 | FALSE | 1.00000 | FALSE |
| Clinical Stage | 0.08071 | 0.13381 | FALSE | 1.00000 | FALSE |
| Immunocompromised | 0.10887 | 0.17587 | FALSE | 1.00000 | FALSE |
| OS Cox PH No Systemic Therapy | 0.17437 | 0.27000 | FALSE | 1.00000 | FALSE |
| OS Cox PH No Borderline AMERK | 0.17629 | 0.27000 | FALSE | 1.00000 | FALSE |
| MSS CRR Complete Case | 0.18000 | 0.27000 | FALSE | 1.00000 | FALSE |
| MSS CRR No Systemic Therapy | 0.21000 | 0.30767 | FALSE | 1.00000 | FALSE |
| OS Cox PH Stage III | 0.22622 | 0.32158 | FALSE | 1.00000 | FALSE |
| OS Cox PH Multiple Imputation | 0.22970 | 0.32158 | FALSE | 1.00000 | FALSE |
| OS Cox PH Stage I | 0.25295 | 0.34643 | FALSE | 1.00000 | FALSE |
| MSS CRR No Bordeline AMERK | 0.28000 | 0.37532 | FALSE | 1.00000 | FALSE |
| MSS CRR Stage I | 0.31000 | 0.40687 | FALSE | 1.00000 | FALSE |
| Pathological Stage | 0.34060 | 0.43791 | FALSE | 1.00000 | FALSE |
| Sex | 0.36264 | 0.44804 | FALSE | 1.00000 | FALSE |
| ECOG | 0.36270 | 0.44804 | FALSE | 1.00000 | FALSE |
| RFS CRR Localized | 0.45000 | 0.54519 | FALSE | 1.00000 | FALSE |
| EFS Cox PH Stage IV | 0.56477 | 0.67133 | FALSE | 1.00000 | FALSE |
| EFS Cox PH Metastatic Disease | 0.64200 | 0.74900 | FALSE | 1.00000 | FALSE |
| EFS Cox PH Stage III | 0.66706 | 0.76409 | FALSE | 1.00000 | FALSE |
| RFS CRR Stage III | 0.81000 | 0.91125 | FALSE | 1.00000 | FALSE |
| MSS CRR Stage III | 0.85000 | 0.93947 | FALSE | 1.00000 | FALSE |
| OS Cox PH Stage IV | 0.87129 | 0.94640 | FALSE | 1.00000 | FALSE |
| MSS CRR Metastatic | 0.89000 | 0.95034 | FALSE | 1.00000 | FALSE |
| OS Cox PH Metastatic Disease | 0.91100 | 0.95655 | FALSE | 1.00000 | FALSE |
| EFS Cox PH AMERK High vs. Low | 0.97645 | 0.99943 | FALSE | 1.00000 | FALSE |
| RFS Cox PH Stage III | 0.98568 | 0.99943 | FALSE | 1.00000 | FALSE |
| RFS Cox PH Stage IV | 0.99943 | 0.99943 | FALSE | 1.00000 | FALSE |
Table S15. Evaluation of statistical persuasiveness. The probability of obtaining test results as extreme as the results actually observed, under the assumption that the null hypothesis is correct, was adjusted for multiplicity of testing using Benjamini-Hochberg (BH) procedure and the Bonferroni test. The original unadjusted p-value is juxtaposed to the p-value adjusted by the BH procedure and Bonferroni test, respectively. A boolean representation of whether the statistical test remained significant after each correction is also represented. Statistical tests that remained significant after adjustment using both methods are shaded grey; those only significant after adjustment using the BH procedure are shaded red. Abbreviations: Assoc., Association; CRR, competing risk regression; ECOG, eastern cooperative group; EFS, event-free survival; MSS, Merkel cell carcinoma-specific survival; OS, overall survival; PH, proportional hazard; RFS, recurrence-free survival.
Table S16. Evaluation of the proportional hazard assumption
| Characteristic | PH Test for RFS Cox Model | PH Test for EFS Cox Model | PH Test for OS Cox Model | PH Test for MSS Cox Model |
|---|---|---|---|---|
| Serostatus | 0.41140989 | 0.27770003 | 0.03713152 | 0.003802173 |
| Age | 0.79818656 | 0.87763024 | 0.62178407 | 0.684892406 |
| Sex | 0.08410741 | 0.09610742 | 0.07805992 | 0.163254554 |
| `Clinical Stage` | 0.87912545 | 0.17561503 | 0.71339605 | 0.959507358 |
| `Baseline ECOG` | 0.58639373 | 0.88782585 | 0.65384060 | 0.396752543 |
| `Immune Suppressed` | 0.60998154 | 0.98123928 | 0.70367753 | 0.453566933 |
| `Initial Treatment Summarized` | 0.20993766 | 0.25187321 | 0.12599747 | 0.238136527 |
| GLOBAL | 0.66655507 | 0.34589441 | 0.03069931 | 0.088281085 |
Table S20. Evaluation of proportional hazard assumption. Schoenfeld test was performed for the cox regression models used for RFS, EFS, OS and MSS. Abbreviations: ECOG: eastern cooperative group, EFS, event-free survival; MSS, Merkel cell carcinoma-specific survival; OS, overall survival; PH, proportional hazard; RFS, recurrence-free survival.
Association of initial AMERK titer and tumor burden
Finally, we performed an analysis of disease burden outcomes besides time-to-event endpoints, to explore the clinical relevance of the initial AMERK titer’s magnitude beyond binary serostatus. Paulson et al. had previously shown in a single-institution cohort (n = 22) that higher anti-T antigen antibody titers were present at diagnosis in seropositive patients with advanced disease compared to those with localized disease.8 In our cohort of seropositive patients (n = 129), we found a strong correlation between the initial AMERK titer and various indicators of tumor burden. These included a distinction between localized and metastatic disease, clinical tumor stage, primary tumor size, pathological nodal stage, and clinical stage at presentation, as evidenced in Figure S2, and Figure S3.
Figure S2 Association of initial AMERK titer and additional measures of tumor burden
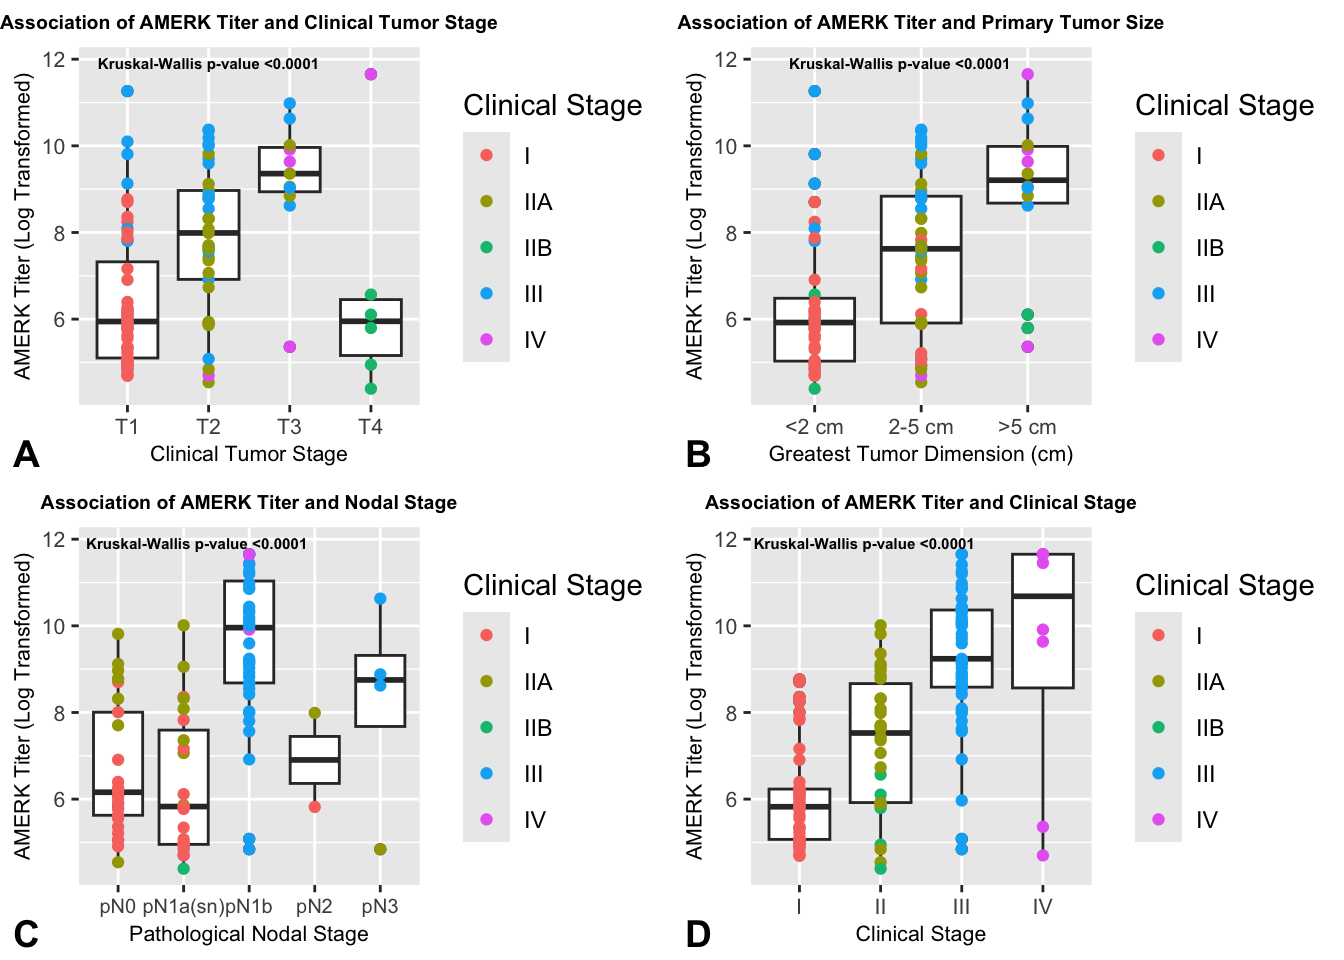
Figure S2. Association of initial AMERK titer and additional measures of tumor burden. Seropositive subjects were stratified based on AJCC 8th edition clinical tumor stage (A) and on greatest primary tumor size (largest size across either clinical, radiographic or pathological measurement) (B). Subjects without a known skin primary were excluded from A and B. In panels C and D, seropositive subjects were stratified based on AJCC 8th edition pathological nodal stage (C) and clinical stage (D). Clinical stage IIA and IIB subjects were binned in panel D. Initial AMERK titer was log-transformed. The initial clinical stage of each subject is color-coded. A non-parametric test (kruskal-wallis) was performed to evaluate differences between these groups.
Figure S3. Association of initial AMERK titer and disease extent
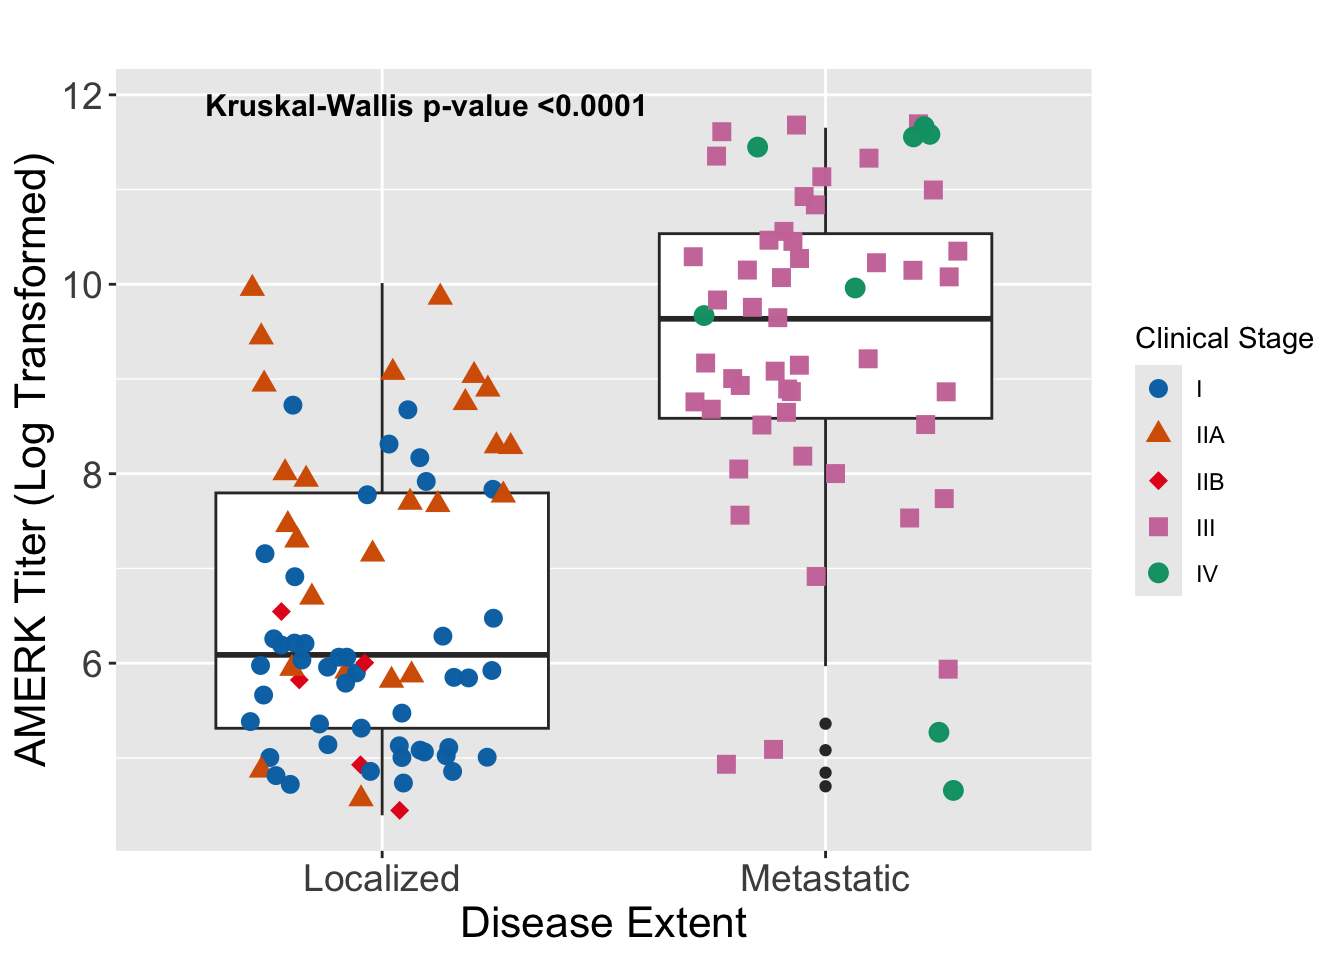
Figure S3. Association of initial AMERK titer and disease extent. Seropositive subjects were stratified based on the extent of disease burden on presentation (e.g. skin-only, “localized”, or nodal/distant metastases, “metastatic”). The initial clinical stage of each subject is color-coded. Initial AMERK titer was log-transformed. A non-parametric test (Kruskal-Wallis) was performed to evaluate differences between these two groups.
Discussion
In this dual-institution cohort study, we sought to understand better the relationship between the presence of circulating MCPyV antibodies and survival outcomes. We corroborated the original report9 of a decreased hazard for recurrence for seropositive patients compared to those who were seronegative near the time of diagnosis. We analyzed several complementary outcomes using regression models to adjust for various confounding variables, and in sensitivity analyses considered potential sources of bias including borderline AMERK results and systemic therapy. Across all analyses, the association of serostatus with reduced recurrence risk remained robust. Notably, our application of the analytic model used by Paulson et al yielded a similar estimated reduction in recurrence hazard (45% decrease in the current report vs. 42% decrease in the previous report). Thus, the totality of evidence, highlighted by statistical persuasiveness and external duplication, supports the value of the initial AMERK for prognosticating recurrence.
Building upon the initial study of RFS by Paulson et al., our study also examines clinically relevant outcome measures of EFS, OS and MSS. Our analyses revealed a strong association between seropositivity and improved EFS, with reductions in the hazard for recurrence, progression or death from any cause ranging from 39-51%, depending on the analytic model. These data also suggest improved survival outcomes in terms of OS and MSS for seropositive patients, though the low incidence of events tempers the certainty of these findings. Importantly, the positive association between serostatus and survival persisted after adjusting for important covariates, such as baseline performance status and initial treatment strategy, which are not often reported in large administrative data sets such as SEER. Ultimately, external validation will be necessary to confirm these findings.
Our findings reinforce the previous observation that the level of the AMERK titer is closely linked to the overall tumor burden.8 Assessing the actual tumor burden in retrospective studies presents substantial challenges, especially for a disease like MCC, which can advance to involve a wide range of anatomical sites, including the bone marrow. Therefore, we utilized multiple surrogates of tumor burden, including clinical stage, greatest tumor dimension and nodal involvement, all of which showed substantial correlation with AMERK titer.
The use of a surrogate marker for disease burden is crucial, particularly for tests that might serve in monitoring disease status over time. Although it was beyond the scope of this current investigation, previous research has highlighted the utility of the AMERK test for surveillance and detecting recurrence of the disease.9 Building on this, we aim to further investigate the role of the AMERK test in disease monitoring in future studies.
The underlying mechanisms linking seropositivity with improved survival in MCC remain unclear. One hypothesis is that seropositivity may solely act as a marker for virus-induced MCC. Two primary oncogenic pathways have been proposed for MCC: infection by the MCPyV and genotoxic damage from ultraviolet (UV) radiation.28–30 Indeed, our study found a higher rate of AMERK seronegative patients with head and neck primary tumors (52% vs. 22%) and these tumors would more likely be associated with UV-induced damage. Literature reports conflicting data on the proportion of MCPyV-driven MCC tumors (ranging from 24% to 100%), and the clinical implications of viral status.28,31–33 A notable study involving 282 cases, which employed multimodal methods for virus detection, found that virus-negative tumors (constituting 20% of cases) had a notably higher risk of disease progression (HR = 1.77) and MCC-related death (HR = 1.85).33. Even if serostatus only indicates virus status, the AMERK test remains valuable as a prognostic tool. Not all pathology labs routinely perform tests to detect viral status in MCC tumors, and clinicians are not always able to have these tests performed on tumor biopsies. However, the AMERK test, being available as a send-out test, offers a practical alternative. It is important to note that the prevalence of AMERK positivity (about 50% in our study and the one reported by Paulson et al.9) does not align with the estimated 80% of virus-driven MCC cases. This discrepancy indicates that seropositivity as a mere surrogate for virus status does not fully account for the observed biological phenomena in MCC. Importantly, MCPyV status determined by IHC did not correlate with response to immune checkpoint inhibitor therapy.34
The role of B cells and circulating antibodies in the pathophysiology of solid tumors, including MCC, is not well understood. In some cancers, the presence of B-cells35 and B-cell-rich tertiary lymphoid structures36 have been associated with improved outcomes. While MCC cases with a robust intratumoral CD8+ lymphocyte invasion had improved outcomes,37 the role of B-cells in the tumor micro-environment remains unclear. Previous studies have suggested a correlation between peripheral blood MCPyV-specific T cell responses and tumor burden, however, the role of antibody titers in influencing T cell responses remains to be defined.38
Interestingly, the association between seropositivity and improved survival was only present in patients with Stage I and II disease. Indeed, the effect seemed most pronounced in those patients with Stage II, with dramatic decreases in the hazards for RFS, EFS, OS and MSS. Our findings do not address a causal relationship between serum oncoproteins and improved survival for patients with localized disease. One possible interpretation is that seropositivity reflects an active immune response that, while not preventing tumor growth, may limit its regional and distant spread. In contrast, patients with more advanced disease, despite having an adaptive immune response producing anti-MCPyV oncoprotein antibodies, may lack a sufficiently comprehensive and effective anti-tumor response. Further research is necessary to explore and clarify these potential mechanisms.
Enhanced risk stratification based on serostatus could lead to tailored management strategies for MCC patients. Current guidelines from the National Comprehensive Cancer Network (NCCN) recommend routine imaging for high-risk MCC patients, defined as those who are immunocompromised or have non-sentinel lymph node metastases.39 Our data, suggest that seronegative Stage I patients exhibit substantial 1- and 2-year recurrence rates (36% and 40%, respectively), while seronegative Stage II patients show even higher rates (61% and 74%, respectively). These results indicate the potential benefit of incorporating surveillance cross-sectional imaging for all seronegative patients.
Furthermore, while the utility of liquid biopsies, such as circulating tumor DNA (ctDNA), in MCC is still under investigation, early evidence supports their clinical relevance.40,41 Focusing on these diagnostic tools in seronegative patients should continue to be a priority for future research. In contrast, for seropositive patients with localized disease that have undergone successful initial tumor removal, routine cross-sectional imaging might be unnecessary, especially if serial AMERK tests are used for ongoing surveillance. This approach could lead to more efficient and targeted follow-up strategies, reducing unnecessary interventions for certain patient groups. AMERK serostatus may also be an important stratification factor for future studies of adjuvant and neoadjuvant therapy in patients with early stage MCC.
While our study supports and strengthens the initial findings by Paulson et al., it is important to acknowledge its limitations. The retrospective and exploratory design of our research introduces threats to internal validity. Evaluating multiple endpoints throughout the study raises the risk of family-wise type I error. Additionally, the presence of missing data introduces the possibility of bias in analyzing the relationship between serostatus and survival outcomes. Our efforts to mitigate these issues include pre-registering the study protocol, comprehensive reporting of all quantitative results, and conducting a range of sensitivity analyses.
As for external validity, there are limitations related to the population and temporal applicability of our findings. Conducted at two major academic medical centers in Boston, Massachusetts—BWH/DFCI and MGH—our study might not represent the broader MCC patient population. Moreover, the rapidly evolving therapeutic landscape for MCC, along with variations in patient management practices across different communities, further complicates the generalizability of our results. Our data encompass patients treated between 2015 and 2022, and while many of our models accounted for initial treatment, the impact of changes over time on our results is not entirely clear. Consequently, without external validation across varied geographic and temporal contexts, further research in more diverse settings is required to fully understand the applicability and robustness of our conclusions.
Despite these limitations, our study serves as an important follow up, supporting the clinical value of integrating the AMERK test in the initial assessment of patients with MCC. The insights provided by this test may facilitate enhanced risk stratification. This improved stratification has the potential to be incorporated into future clinical trials, particularly in identifying a subset of high-risk patients who might benefit most from tailored peri-operative therapeutic interventions. By distinguishing patients based on their risk profiles more accurately, the AMERK test could play an important role in refining and personalizing treatment approaches for MCC.
Appendix
Author Contributions
David M. Miller: Conceptualization (lead); Data Curation (lead); Formal Analysis (lead); Funding Acquisition (lead); Investigation (lead); Methodology (lead); Project Administration (lead); Programming (lead); Validation (lead); Visualization (lead); Writing - Original Draft Preparation (lead). Sophia Z. Shalhout: Conceptualization (supporting); Data Curation (supporting); Formal Analysis (supporting); Funding Acquisition (supporting); Investigation (supporting); Methodology (supporting); Project Administration (supporting); Writing - Reviewing and Editing (supporting). Kayla Wright: Investigation (supporting); Writing - Reviewing and Editing (supporting). Matt Miller: Investigation (supporting); Writing - Reviewing and Editing (supporting). Howard L. Kaufman: Investigation (supporting); Writing - Reviewing and Editing (supporting). Kevin S. Emerick: Investigation (supporting); Writing - Reviewing and Editing (supporting). Harrison Reeder: Methodology (supporting); Writing - Reviewing and Editing (supporting). Ann W. Silk: Investigation (supporting); Writing - Reviewing and Editing (supporting). Manisha Thakuria: Conceptualization (supporting); Investigation (supporting); Writing - Reviewing and Editing (supporting).
Acknowledgements
This study was funded by Project Data Sphere and ECOG-ACRIN. Matt Miller was affiliated with Massachusetts General Hospital at the time of this research. This work was conducted with support from Harvard Catalyst | The Harvard Clinical and Translational Science Center (National Center for Advancing Translational Sciences, National Institutes of Health Award UL1 TR002541) and financial contributions from Harvard University and its affiliated academic healthcare centers.
Conflicts of Interest Statement
Howard L. Kaufman is an employee of Ankyra Therapeutics and serves on advisory boards for Castle Bioscience, Marengo Therapeutics, MidaTech Pharma, Tatum Biosciences, and Virogin Biotech Ltd. Ann W. Silk has received consulting fees from Natera. The other authors report no conflicts relevant to this study.
Data Availability Statement
The data underlying this article will not be shared so as to protect the privacy of the individuals who participated in the study.
References
1.
Paulson, K. G. et al. Merkel cell carcinoma: Current US incidence and projected increases based on changing demographics. Journal of the American Academy of Dermatology 78, 457–463.e2 (2018).
2.
Singh, N. et al. Clinical benefit of baseline imaging in Merkel cell carcinoma: Analysis of 584 patients. Journal of the American Academy of Dermatology 84, 330–339 (2021).
3.
Allen, P. J. et al. Merkel Cell Carcinoma: Prognosis and Treatment of Patients From a Single Institution. Journal of Clinical Oncology 23, 2300–2309 (2005).
4.
Soult, M. C., Feliberti, E. C., Silverberg, M. L. & Perry, R. R. Merkel cell carcinoma: high recurrence rate despite aggressive treatment. Journal of Surgical Research 177, 75–80 (2012).
5.
Santamaria-Barria, J. A. et al. Merkel Cell Carcinoma: 30-Year Experience from a Single Institution. Annals of Surgical Oncology 20, 1365–1373 (2012).
6.
Mattavelli, I. et al. Prognostic factors in Merkel cell carcinoma patients undergoing sentinel node biopsy. European Journal of Surgical Oncology (EJSO) 43, 1536–1541 (2017).
7.
McEvoy, A. M. et al. Recurrence and Mortality Risk of Merkel Cell Carcinoma by Cancer Stage and Time From Diagnosis. JAMA Dermatology 158, 382 (2022).
8.
Paulson, K. G. et al. Antibodies to Merkel Cell Polyomavirus T Antigen Oncoproteins Reflect Tumor Burden in Merkel Cell Carcinoma Patients. Cancer Research 70, 8388–8397 (2010).
9.
Paulson, K. G. et al. Viral oncoprotein antibodies as a marker for recurrence of Merkel cell carcinoma: A prospective validation study. Cancer 123, 1464–1474 (2016).
10.
R Core Team. R: A language and environment for statistical computing. (R Foundation for Statistical Computing, 2022).
11.
Mayer, M. Confintr: Confidence intervals. (2023).
12.
Wickham, H., François, R., Henry, L. & Müller, K. Dplyr: A grammar of data manipulation. (2022).
13.
Sjoberg, D. D., Whiting, K., Curry, M., Lavery, J. A. & Larmarange, J. Reproducible summary tables with the gtsummary package. The R Journal 13, 570–580 (2021).
14.
Bache, SM., Wickham, H. & Henry, L. Magrittr: A forward-pipe operator for r. R package Version 2.0.1, (2020).
15.
Buuren, S. van & Groothuis-Oudshoorn, K. Mice: Multivariate imputation by chained equations in r. 45, 1–67 (2011).
16.
Wickham, H. & Henry, L. Purrr: Functional programming tools. (2023).
17.
Wickham, H., Hester, J. & Francois, R. Readr: Read rectangular text data. R package Version 1.4.0, (2020).
18.
Mahto, A. Splitstackshape: Stack and reshape datasets after splitting concatenated values. R package Version 1.4.8, (2019).
19.
Wickham, H. Stringr: Simple, consistent wrappers for common string. R package Version 1.4.0, (2019).
20.
Therneau, T. M. A package for survival analysis in r. (2022).
21.
Wickham, H. & Girlich, M. Tidyr: Tidy messy data. (2022).
22.
Wickham, H. ggplot2: Elegant graphics for data analysis. (Springer-Verlag New York, 2016).
23.
Iannone, R. et al. Gt: Easily create presentation-ready display tables. (2023).
24.
Kassambara, A., Kosinski, M. & Biecek, P. Survminer: Drawing survival curves using ’ggplot2’. (2021).
25.
Allaire, J. Quarto: R interface to ’quarto’ markdown publishing system. (2022).
26.
OpenAI. GPT-4 technical report. https://cdn.openai.com/papers/gpt-4.pdf (2023).
27.
Paulson, K. G. et al. Viral oncoprotein antibodies as a marker for recurrence of merkel cell carcinoma: A prospective validation study. Cancer 123, 1464–1474 (2017).
28.
Feng, H., Shuda, M., Chang, Y. & Moore, P. S. Clonal Integration of a Polyomavirus in Human Merkel Cell Carcinoma. Science 319, 1096–1100 (2008).
29.
Harms, P. W. et al. The Distinctive Mutational Spectra of Polyomavirus-Negative Merkel Cell Carcinoma. Cancer Research 75, 3720–3727 (2015).
30.
Goh, G. et al. Mutational landscape of MCPyV-positive and MCPyV-negative Merkel cell carcinomas with implications for immunotherapy. Oncotarget 7, 3403–3415 (2015).
31.
Garneski, K. M. et al. Merkel Cell Polyomavirus Is More Frequently Present in North American than Australian Merkel Cell Carcinoma Tumors. Journal of Investigative Dermatology 129, 246–248 (2009).
32.
Rodig, S. J. et al. Improved detection suggests all Merkel cell carcinomas harbor Merkel polyomavirus. Journal of Clinical Investigation 122, 4645–4653 (2012).
33.
Moshiri, A. S. et al. Polyomavirus-Negative Merkel Cell Carcinoma: A More Aggressive Subtype Based on Analysis of 282 Cases Using Multimodal Tumor Virus Detection. Journal of Investigative Dermatology 137, 819–827 (2017).
34.
Kaufman, H. L. et al. Avelumab in patients with chemotherapy-refractory metastatic Merkel cell carcinoma: a multicentre, single-group, open-label, phase 2 trial. The Lancet Oncology 17, 1374–1385 (2016).
35.
Hennequin, A. et al. Tumor infiltration by Tbet+ effector T cells and CD20+ B cells is associated with survival in gastric cancer patients. OncoImmunology 5, e1054598 (2015).
36.
Petitprez, F. et al. B cells are associated with survival and immunotherapy response in sarcoma. Nature 577, 556–560 (2020).
37.
Paulson, K. G. et al. Transcriptome-Wide Studies of Merkel Cell Carcinoma and Validation of Intratumoral CD8+ Lymphocyte Invasion As an Independent Predictor of Survival. Journal of Clinical Oncology 29, 1539–1546 (2011).
38.
Afanasiev, O. K. et al. Merkel Polyomavirus-Specific T Cells Fluctuate with Merkel Cell Carcinoma Burden and Express Therapeutically Targetable PD-1 and Tim-3 Exhaustion Markers. Clinical Cancer Research 19, 5351–5360 (2013).
39.
NCCN clinical practice guidelines in oncology (NCCN guidelines®) for merkel cell carcinoma v.1.2023. © National Comprehensive Cancer Network, Inc. 2023. All rights reserved. Accessed [November 15, 2023]. To view the most recent and complete version of the guideline, go online to NCCN.org.
40.
Shalhout, S. Z., Emerick, K., Kaufman, H. L. & Miller, D. M. Clinical utility of cell-free DNA liquid biopsies in merkel cell carcinoma. Dermatology Online Journal 27, (2021).
41.
Yeakel, J. et al. Bespoke circulating tumor DNA as a biomarker for treatment response in a refractory Merkel cell carcinoma patient. JAAD Case Reports 18, 94–98 (2021).