Data Quality Improvement in Cancer Registries- Error-Injection Tests
Abstract
A proposed workflow for monitoring completion of retrospective records in a patient registry hosted on REDCap
Objectives:
- Clinical Real-World Data (RWD) captured outside the context of clinical trials from electronic health or medical records (EHR/EMR) is a rich source of information. Transforming this unstructured digital repository of treatments, outcomes, and the longitudinal patient experience into highly structured data poses significant challenges for real-world setting data capture and analysis. Therefore, strategies to facilitate the collection of RWD are sorely needed. Of note, data collection from EHRs should only be conducted under a protocol approved by the respective Institutional Review Board (IRB).
High Quality Data Collection in Cancer Registries
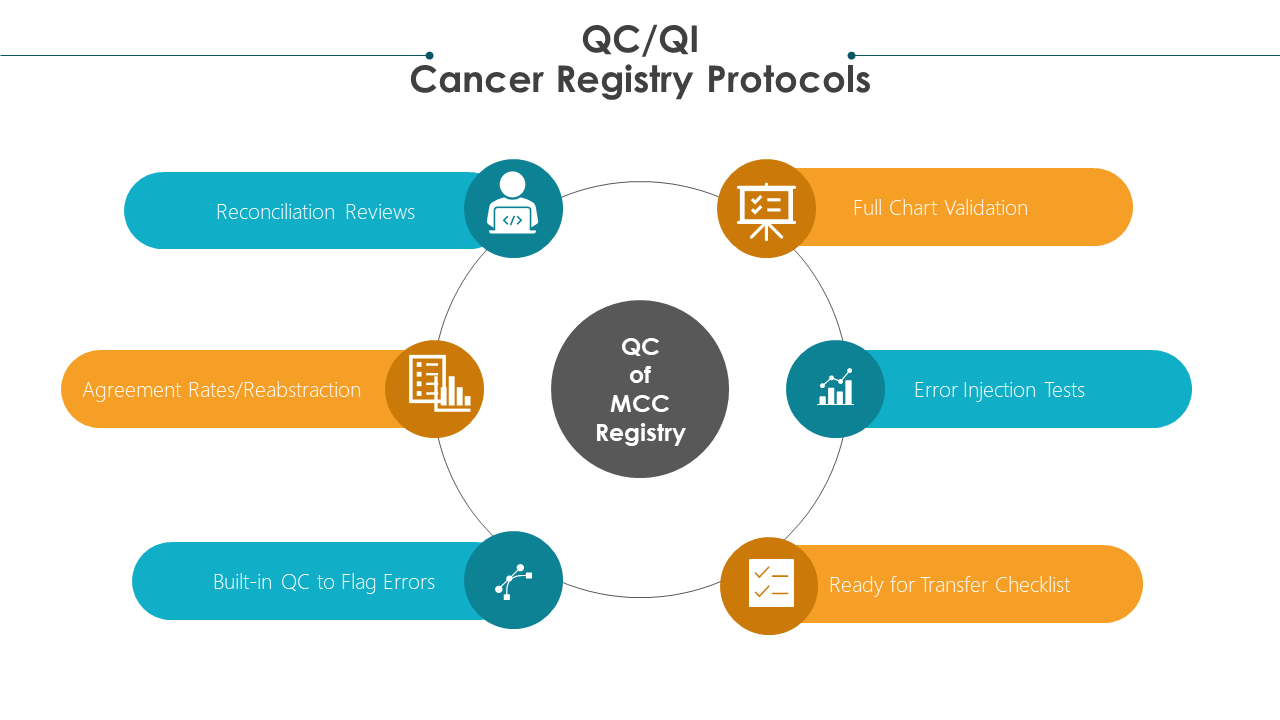
- Cancer registries require quality control (QC) and quality improvement (QI) protocols
- High quality registry data focuses on two metrics:
- completeness of the abstracted charts and data fields
- accuracy of the data abstracted on each cancer patient.
Several QC technical data processing methods should be routinely implemented to ensure the reliable and accurate collection of data.
Such methods should focus on ensuring complete data abstraction such as data quality profiles (DQP). DQPs help to report the percent of cases for which a specific data item is not collected or is coded as unknown/not reported. In addition, it allows for filtering only those records “ready for submission/transfer” using QC checklists.
Other processes should center on establishing accurate data collection including reabstraction/double abstraction methods, where the same data fields are collected for the same patient at least two times to ensure accuracy.
Random spot-checks/audits can be incorporated to determine integrity of the data. For example, only 30% of the charts randomly may be double abstracted. Only if the error rate is high will more charts be double abstracted.
Comprehensive full-record validation methods require checking every data item previously recorded. This is not necessarily a reabstraction/double abstraction but a review of every single data item in the chart.
Built-in QC methods such as having minimum and maximum numeric ranges set may also be implemented in certain data fields such as lab values to prevent errors. They also alert the abstractor of captured errors in real time.
QI methods are proactive, goal-oriented protocols that allow for continuous improvement in collection activity and continue to enhance skills and training of registrars/abstractors.
In this monograph, we will discuss the implementation of error injection tests for QI in REDCap based cancer registries introduced while comprehensive full-record validation QC methods are being carried out.
The concept of error injection tests can be implemented and adapted into any cancer registry system.
Here, we describe a method for collecting and tracking data metrics on error injection results for those registries utilizing REDCap.
Overview of REDCap
- REDCap is a user-friendly, web-based research electronic data capture platform utilized by researchers worldwide to collect structured data for statistical analysis.1,2
- It is a powerful, secure, and HIPAA compliant database building solution created by Vanderbilt University in 2004 that allows development and deployment of subject facing surveys as well as forms for data capture by data entry personnel
- Our lab has adopted REDCap as the data collection platform for our rare cutaneous tumor patient registries. We have additionally deployed modules built in REDCap to streamline and analyze operations in the multidisciplinary clinic setting
Error-Injection Tests:
Key Points
- In this monograph we provide tips and recommendations to implement error-injection tests for QC and QI to ensure high quality data is captured in cancer patient registries.
- An Error-injection test is an unbiased method that informs the registry team of the true error detection rate.
- After this monograph, you will:
- Learn how to carry out and implement error-injection tests
- Understand how to routinely capture QC metrics to continuously improve skills
- Skill Level: Intermediate Knowledge of REDCap Instrument Database design and basic data wrangling in R is required.
Aim 1: What is an Error Injection Test (EIT)?
- An Error-Injection test is a technique that deliberately introduces errors into a system such as a patient database to ensure it can withstand, properly detect, and recover from errors based on the current QC/QI protocols implemented.
- It is designed to intentionally inject errors in a controlled, well-documented and unbiased manner.
- The exact errors and their location/data field/chart are blinded to the QC manager who is assigned the responsibility of detecting data abstraction errors while conducting full-chart comprehensive data validation.
- Logs and Tracking systems allow for data analytics/metrics to determine how many errors are caught versus the error- miss rate.
- This leads to true accuracy of error detection performance during QC registry protocols and reflects the true unbiased error detection rate.
- The performance of each person performing the QC can be assessed to provide teaching lessons and improve skills moving forward.
- EITs aid in understanding if the current established protocols and executions of the QC protocols are sufficient to ensure high quality data.
- Data metrics on the ‘error catch’ and ‘miss rates’ are easily determined and can be tracked for quality improvements with time.
- EITs help inform strategies to improve QC and error detection as well as improve training methods for staff.
- Finally, EITs must be carried out under as-close-to-normal conditions as possible.
- For example, the person carrying out the validation such as the QC manager should remain blinded to EITs to reduce bias.
- This means the QC manager should be completely unaware which errors are intentionally introduced, where they are introduced, and when an EIT is being carried out to simulate normal QC behaviors, implementation and execution of QC protocols and procedures.
Aim 2: Quality Control Protocol: Implementing Full-chart Comprehensive Data Validation
QC methods including reabstraction/double abstraction as well as full chart comprehensive data validation protocols are implemented to ensure integrity and accuracy of the data collected.
Validation of data ensures and measures consistency in data abstraction and coding in the registry.
A QC manager validates every data element captured by the data abstractor for specified charts.
This comprehensive review and validation of every data element captured in the chart ensures integrity and accuracy of the data, as well as completeness of the chart.
If an error is detected with high degree of confidence, the data field/element must be corrected.
However, team reconciliation meetings are held on a regular basis to review all discrepant answers.
RECONCILIATION REVIEW SESSIONS
- Reconciliation meetings allow for the identification of any revisions that may be needed to clarify the data field guide.
- These meetings also allow for clarifications on what type of data reflects the true data element intended for capture for that field.
- These meetings highlight the need for updated or extra training to improve team performance.
- Furthermore, reconciliation reviews ensure that changes made to the database are correct and not actually introducing more errors during validation QC protocols.
VALIDATION PROTOCOL
- Full-chart comprehensive data validation allows for the continuation of QI and performance in the registry.
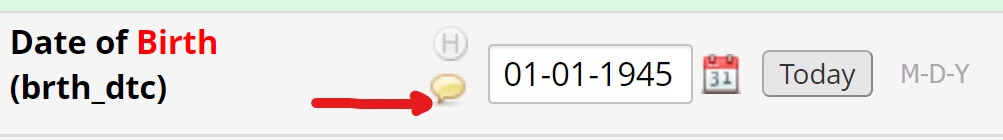
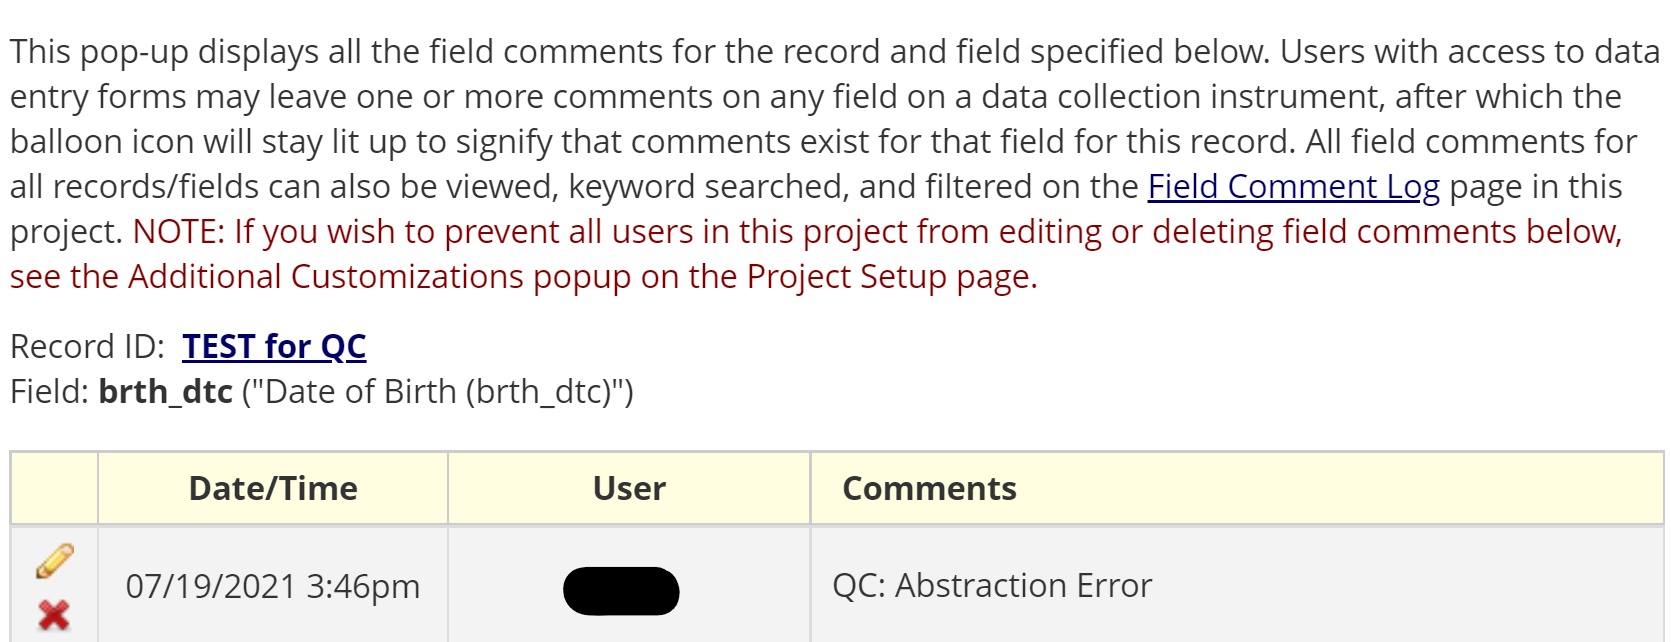
- To keep a history of any errors caught and changed during the validation QC protocol, the REDCap comment bubble associated with each data field can be utilized for tracking.
- The comment bubble can be used to document that an error was detected during QC.
- It is also automatically associated with the data field the error was detected in.
- This allows for data metrics that may inform the distribution/frequency of errors.
DATA METRICS
- Comments can be used to track if errors are randomly distributed throughout the charts or highly enriched in certain instruments or data fields.
- This may help improve training or clarification needs of the team.
- It may also lead to improvements or simplification revisions to the data field or guide if found to be overly problematic with errors repeatedly detected.
- The comment bubbles should be used to describe the QC error as well to allow for data metrics on types of errors.
EXAMPLE CASE
- For example, if during validation, the year for the date of birth of a patient was incorrectly captured, protocol requires the data to be changed and commented on to highlight the type of error.
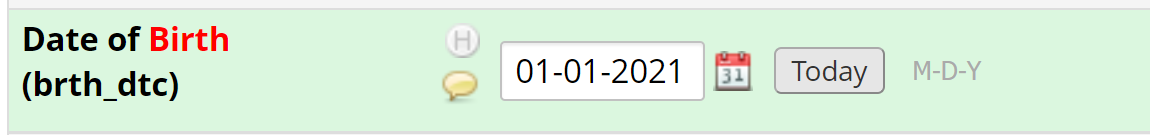
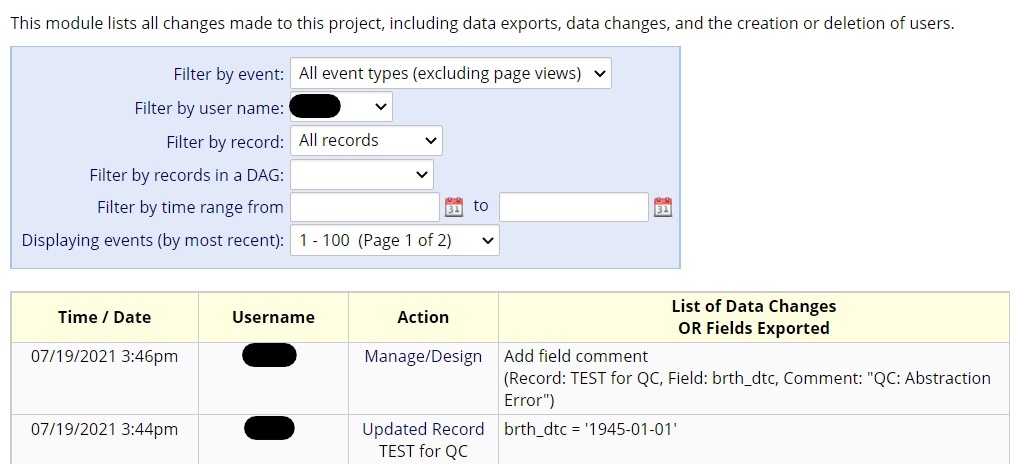
- The year should be modified to reflect the correct data. For example, if the electronic health record shows the patient was born in 1945, the field should be updated and saved.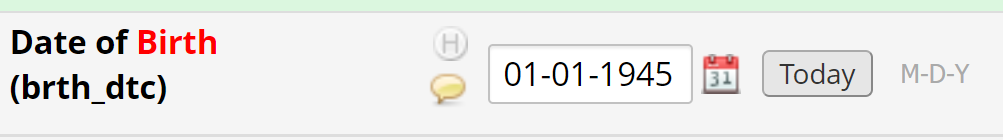
- Finally, the comment bubble should be utilized and the type of error documented using pre-determined strings for the type of error.
- Pre-determined strings provide ease for text mining the logs to determine the errors detected or any changes made.
- For example, the following strings may be used in the respective cases:
- QC:AE (for abstraction error)
- QC:DEE (for Data Entry Error)
- QC:NE (for Not an Error)
- QC: Full Instance Creation
- QC: Error Injection
- QC: Full Instance Duplication
- For example, the following strings may be used in the respective cases:
- REDCap’s comment bubble found in every data field coupled with the tracking/logging feature, allow for back-end data wrangling of every time a chart or data field was updated/changed due to catching/finding an error.
- The strings/characters used to describe the QC errors in the comment bubbles should be structured/pre-determined and not free-text as described in the examples above.
- This allows for quantitative data metrics to inform performance of registry QC protocols including the number of errors caught as well as the type of QC changes made.
- A follow-up monograph will focus on how to utilize data wrangling in R to determine QC metrics from the log and QC error comments.
Aim 3: Implementing EITs
- In order to implement EITs, the QC manager carrying out Full-chart Comprehensive Data Validation is not informed of the schedule or time for EITs or the type of errors to be introduced.
- Furthermore, the QC manager is blinded from knowing where/which charts the errors are injected into.
- The site PI can inject errors into the charts assigned to the QC manager for full chart validation.
- These errors are intentionally injected and recorded so that even if the QC manager does not detect them, they are changed and recorded in the comment bubble as QC:Error injection test to distinguish them from non-intentional errors natural to the process.
- The EIT will allow for an unbiased error catch rate and error miss rate.
- The type of errors introduced should be realistic.
- Using the errors often discovered in non-test settings, the comment bubbles should be used to determine “real-case” errors often introduced in the registry. These real-case errors should guide the creation of the types and locations of intentional errors used in EITs.
- The QC manager is blinded to the specifics of the EITs to avoid QC protocol ‘over performance’ such as spending extra time and energy on validating the data in a patient chart just because a test is taking place.
- This would lead to biased inflation of error detection rates and would not reflect true normal procedures/efforts.
- Therefore, results would not allow for informing actual improvement measures.
- Intentionally injected errors are well-documented in type, error, location and what the correct data element code should be.
- Once the QC manager has finished validating all of the charts that have had an error intentionally injected, the site PI can unblind the test to the QC manger.
- With the tracking system and log, basic data wrangling skills in R can be used to determine which intentional errors were caught and corrected, and which were missed. All missed errors will be systematically corrected and commented on as EIT errors.
- An error detection rate and error catch rate can then be calculated.
- QC review sessions where errors and EIT results are discussed may help improve training and site performance.
- Trends in detection/miss rates should inform if improvements occur over time with each EIT carried out.
- A followup monograph in this series will focus on using R and data wrangling skills to obtain metrics on QC as well as EITs.