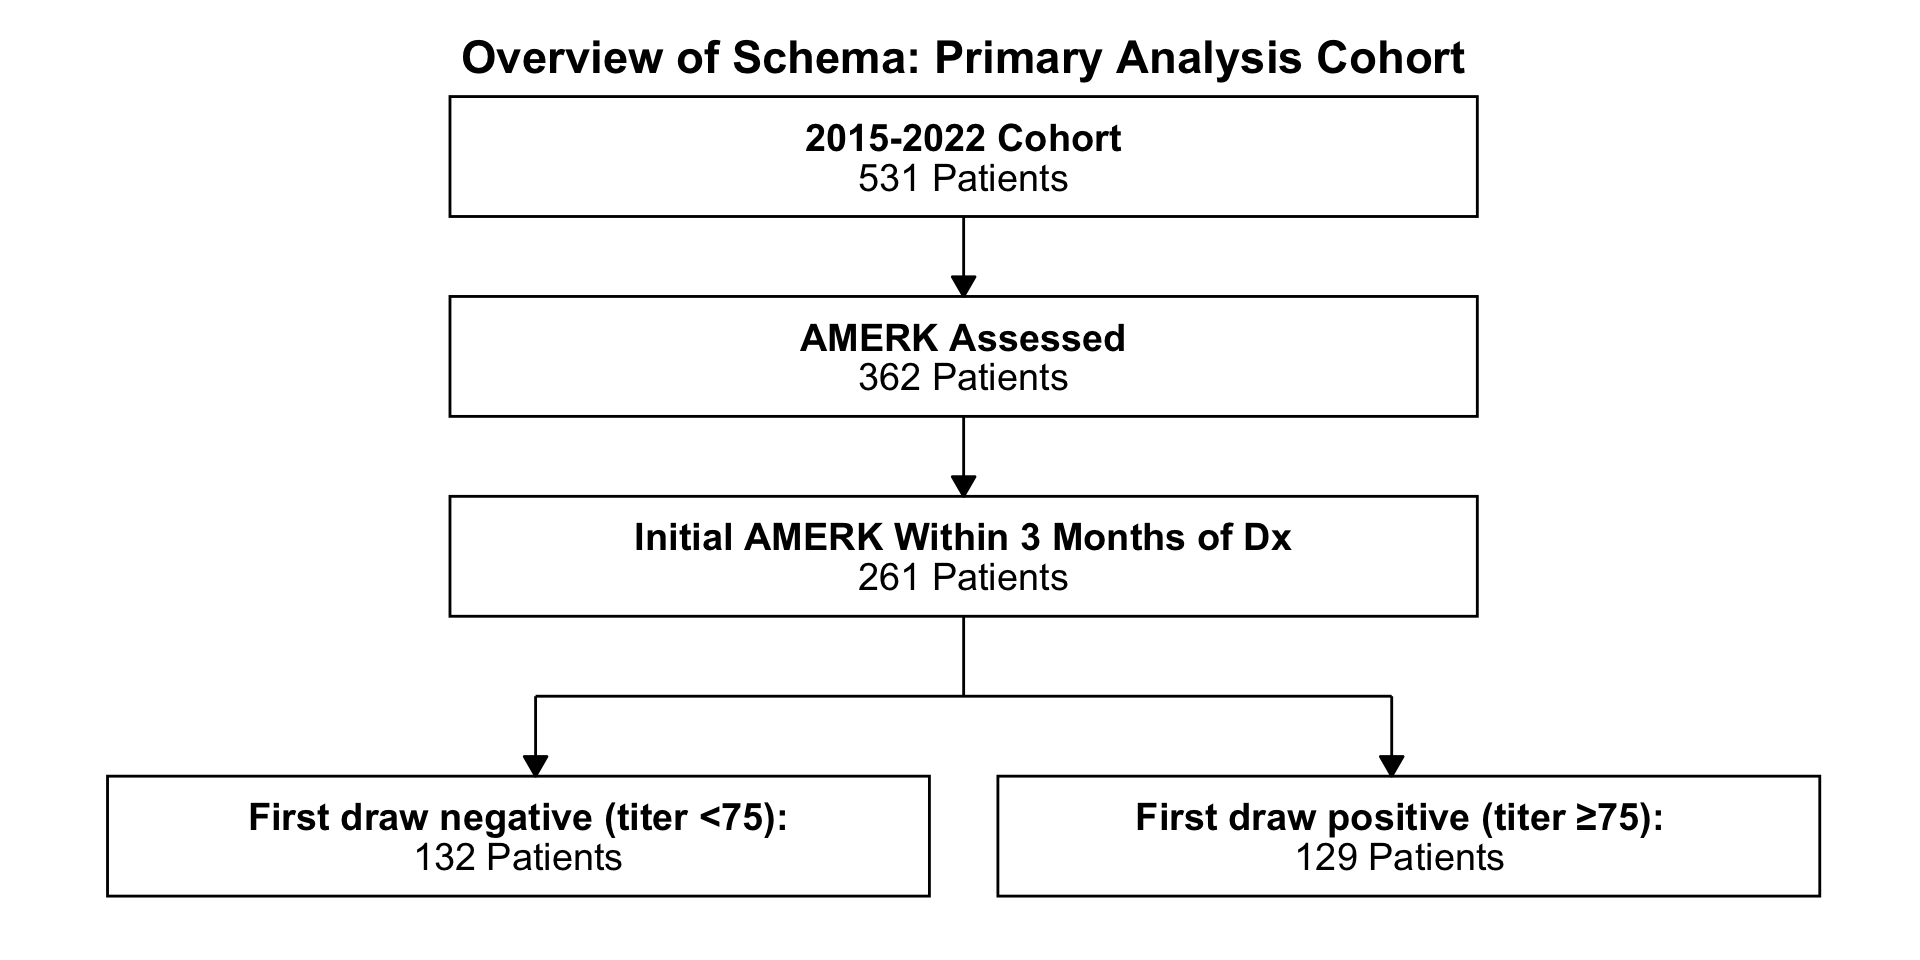
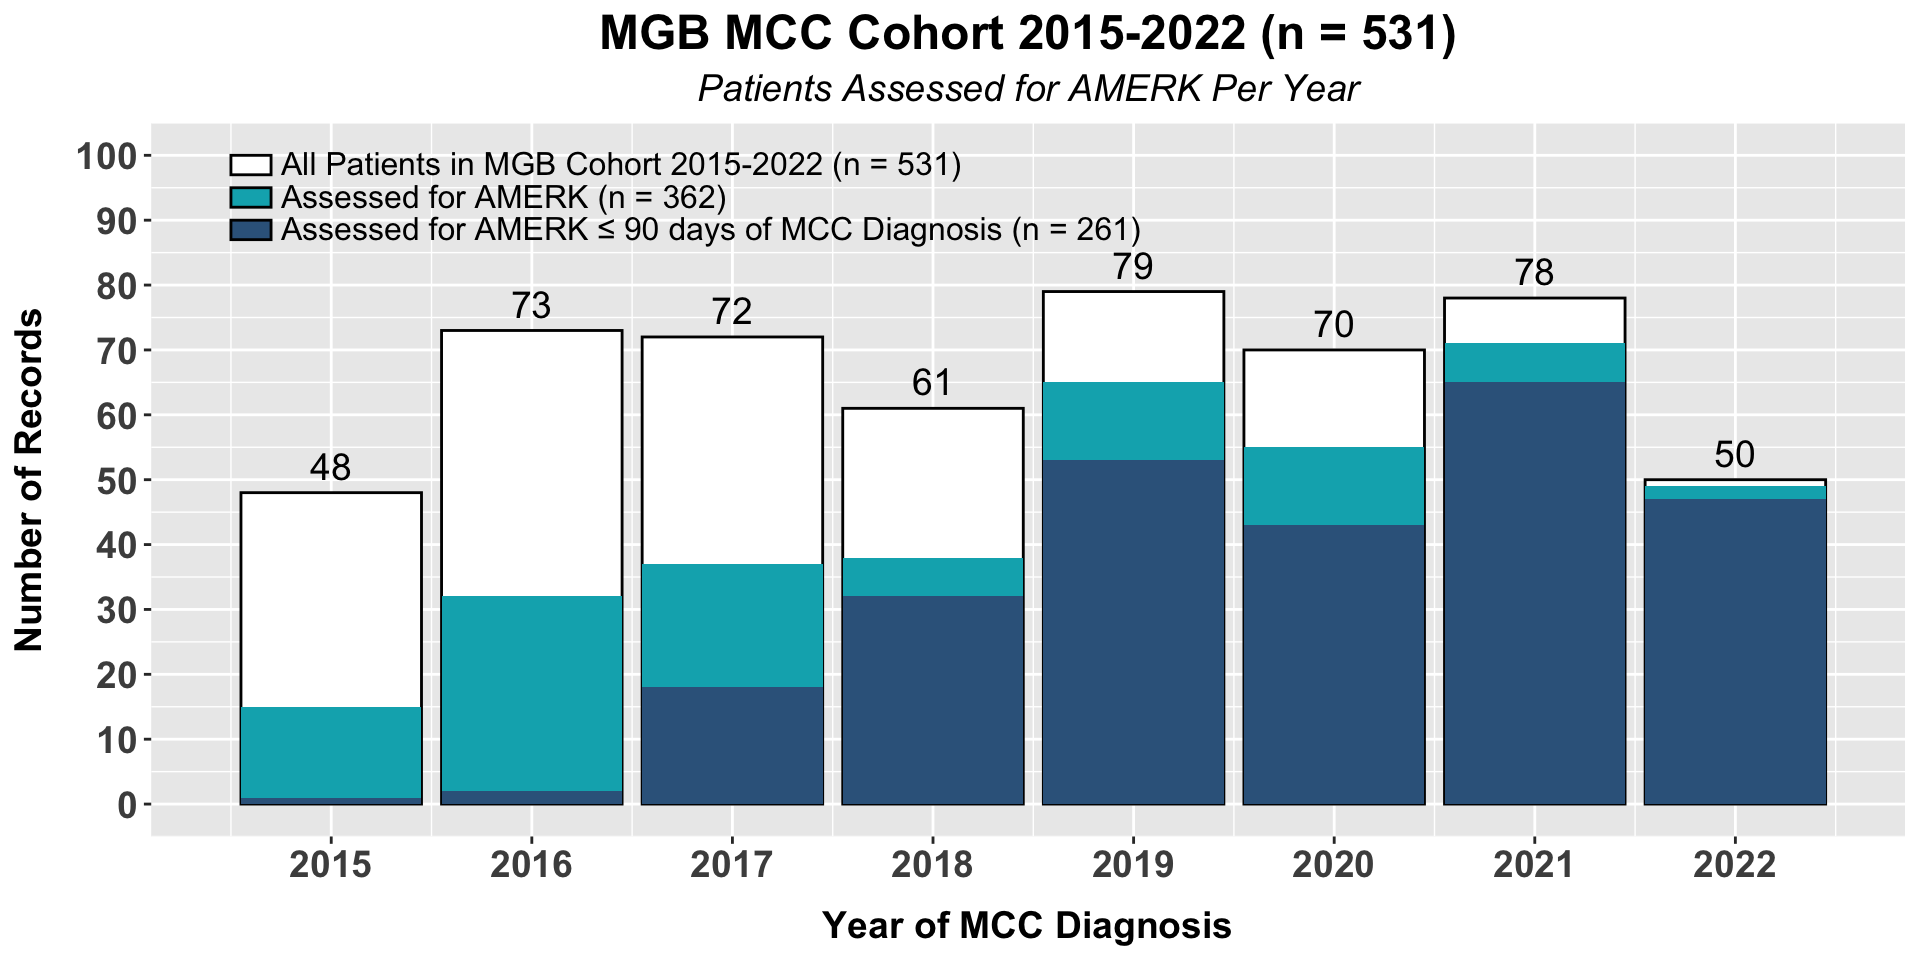
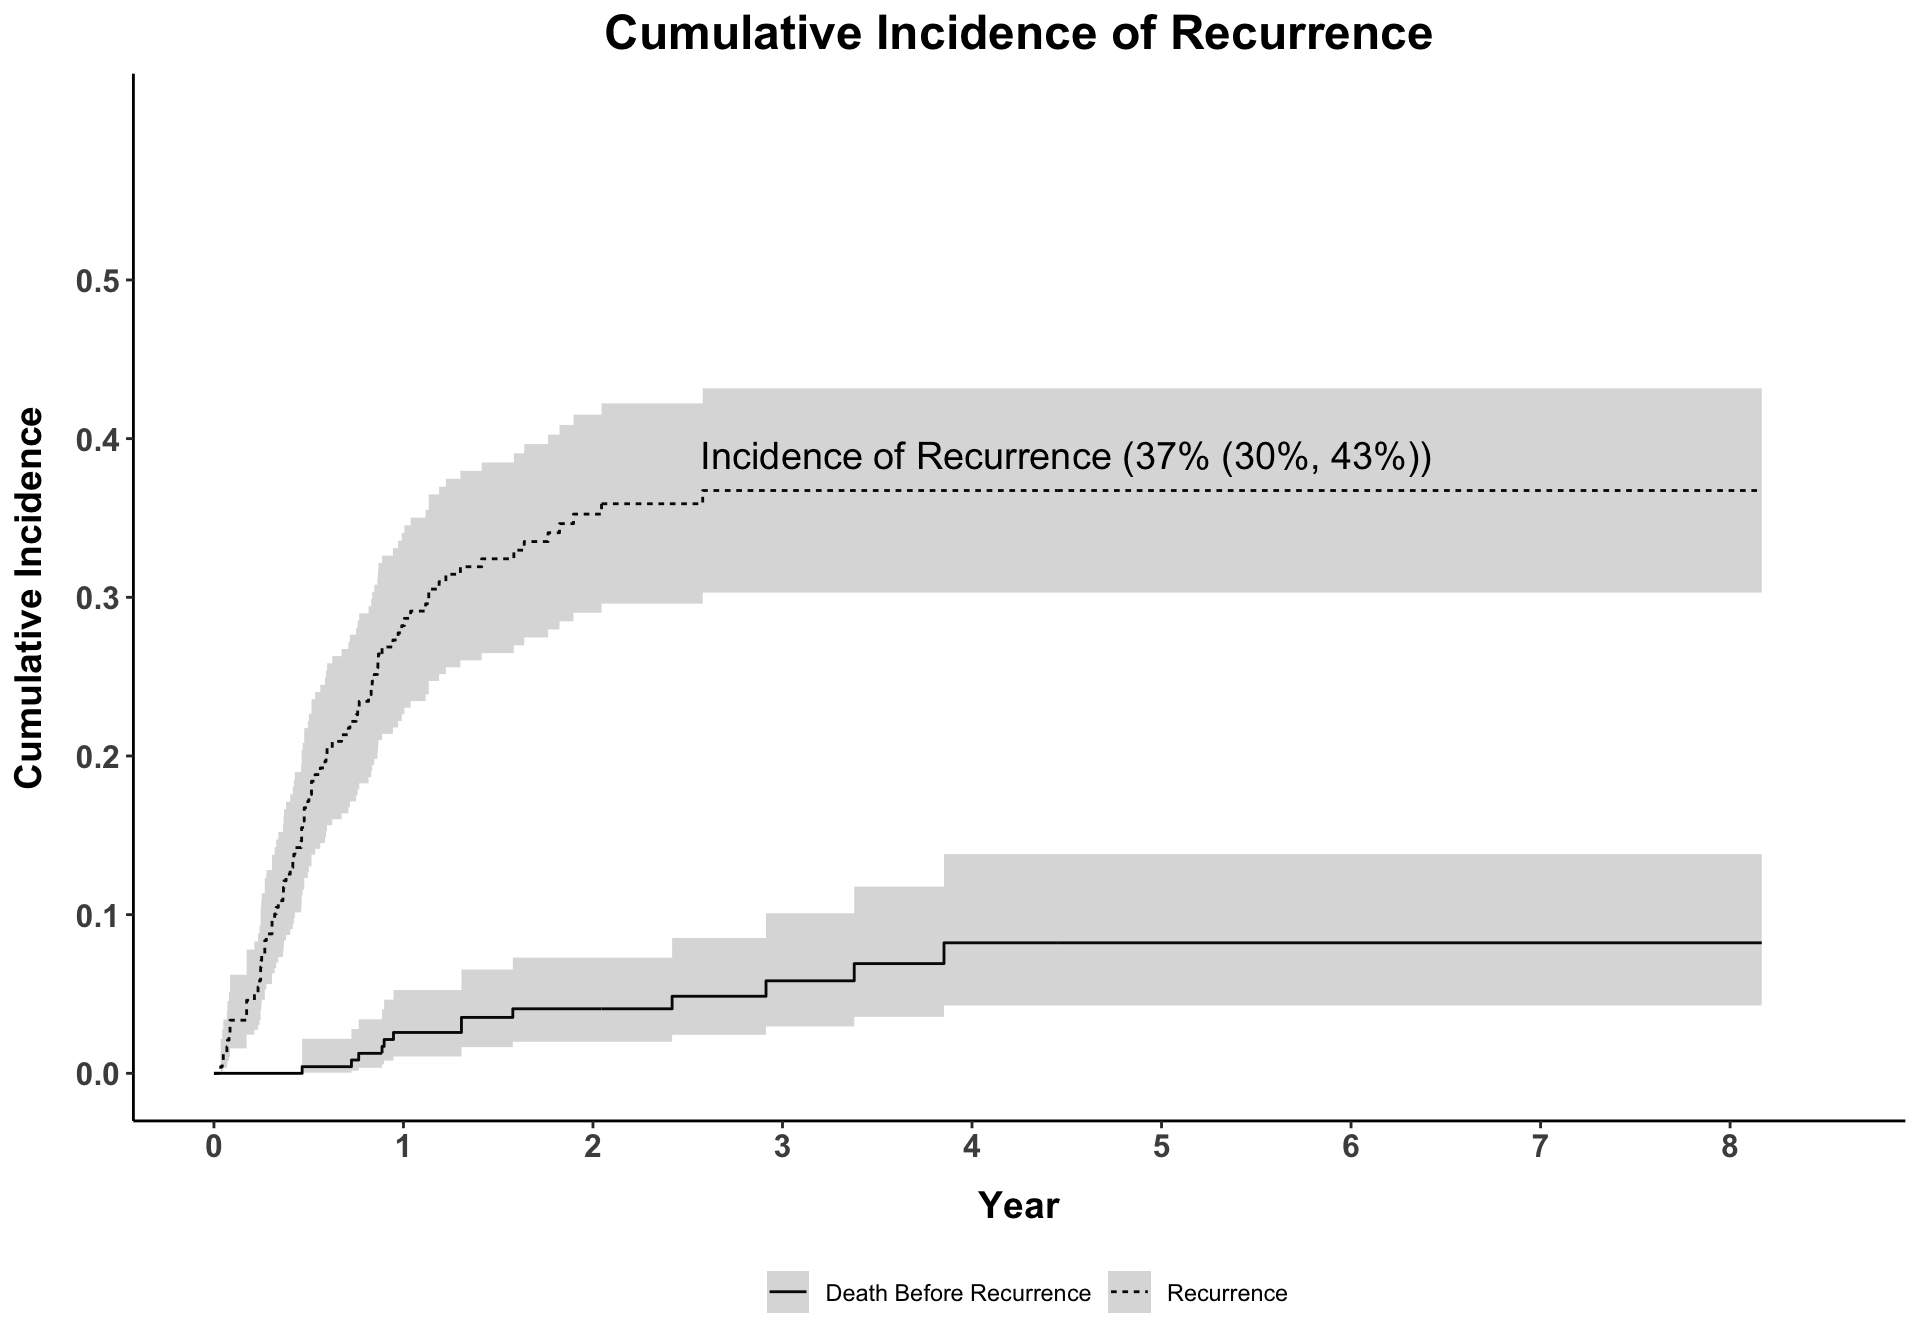
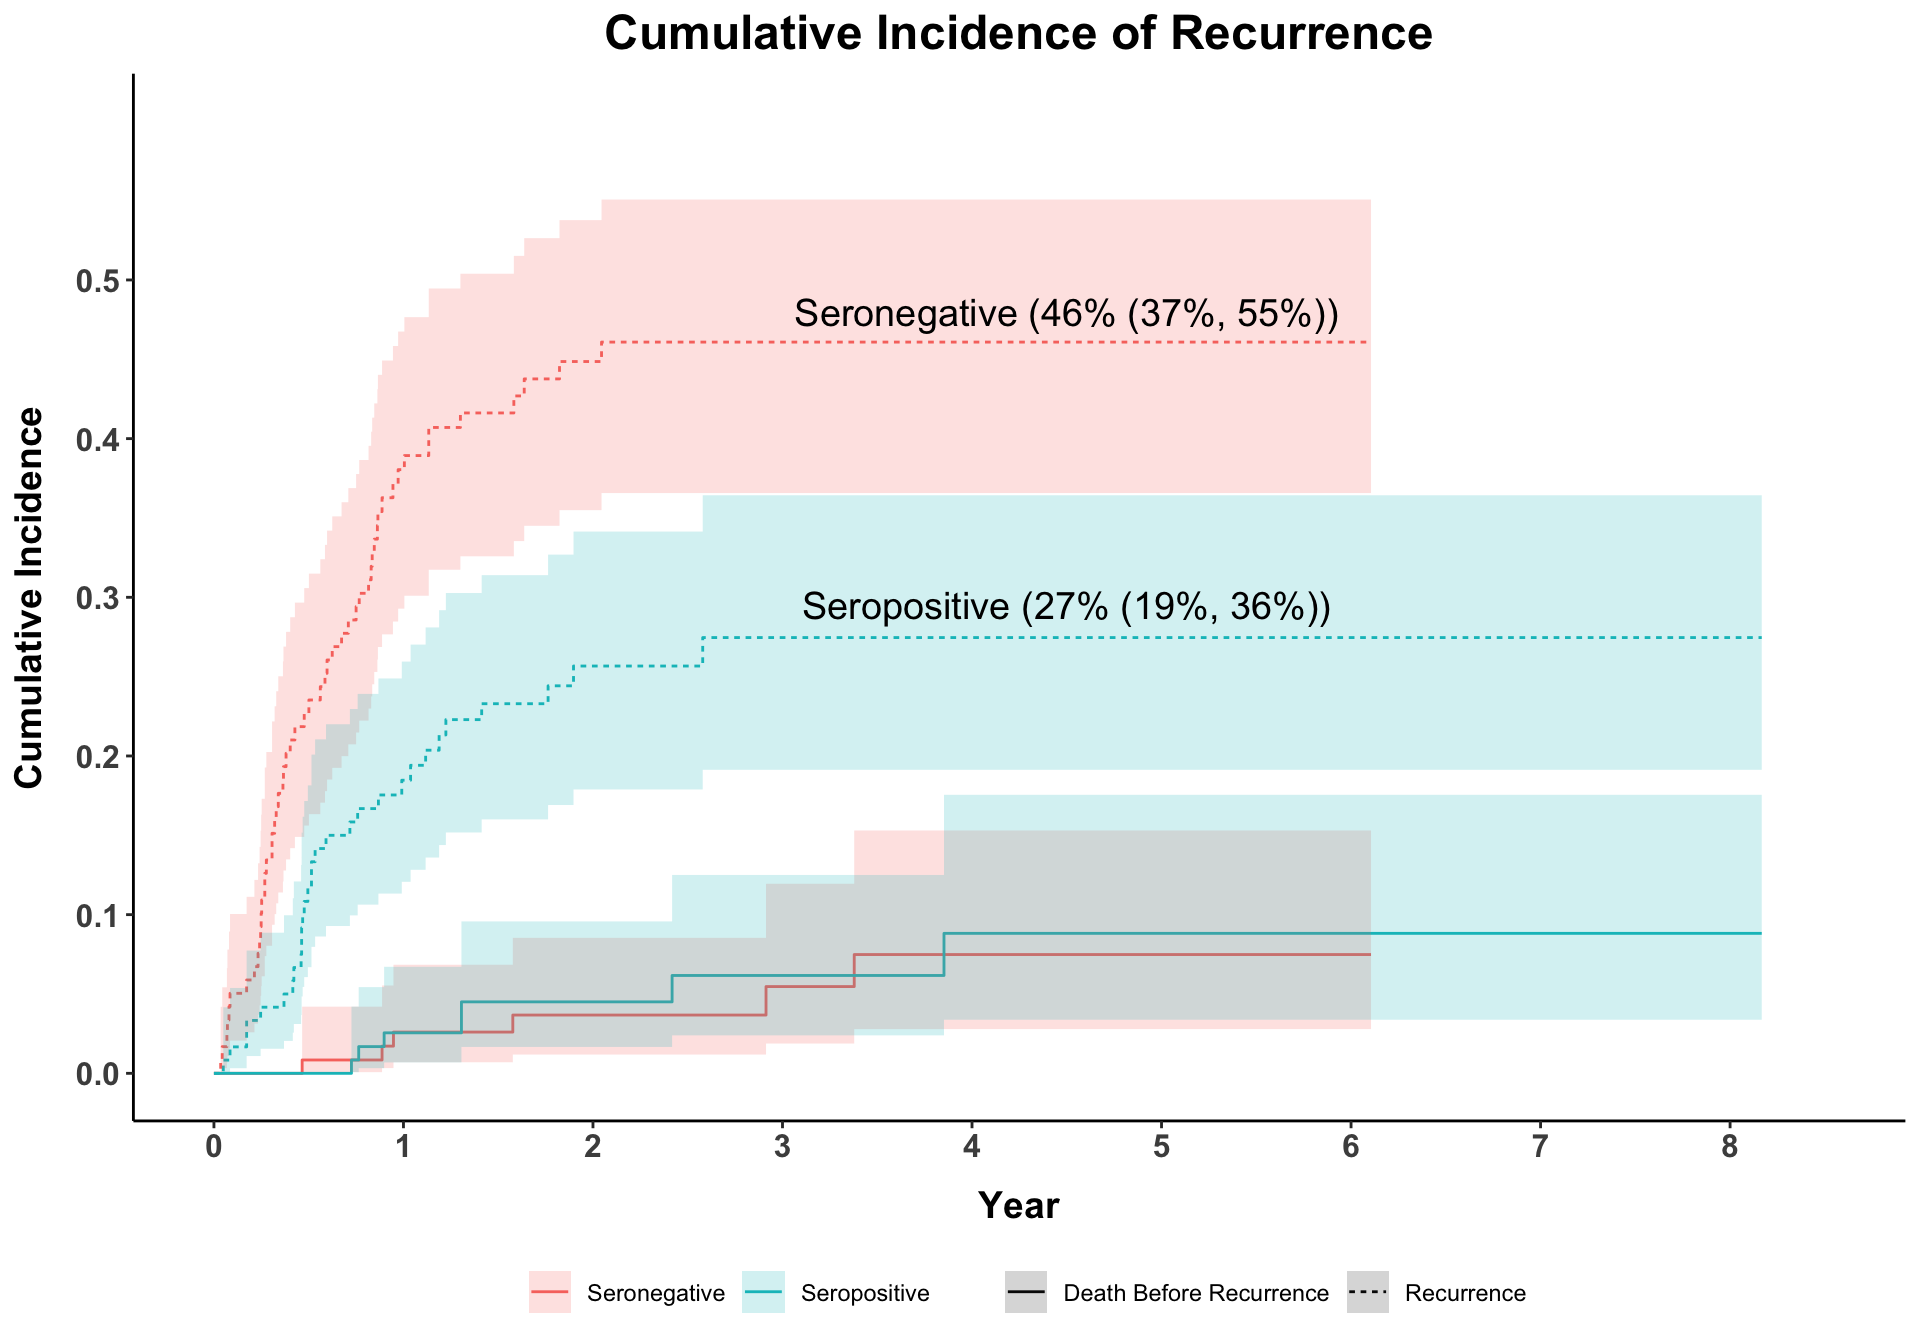
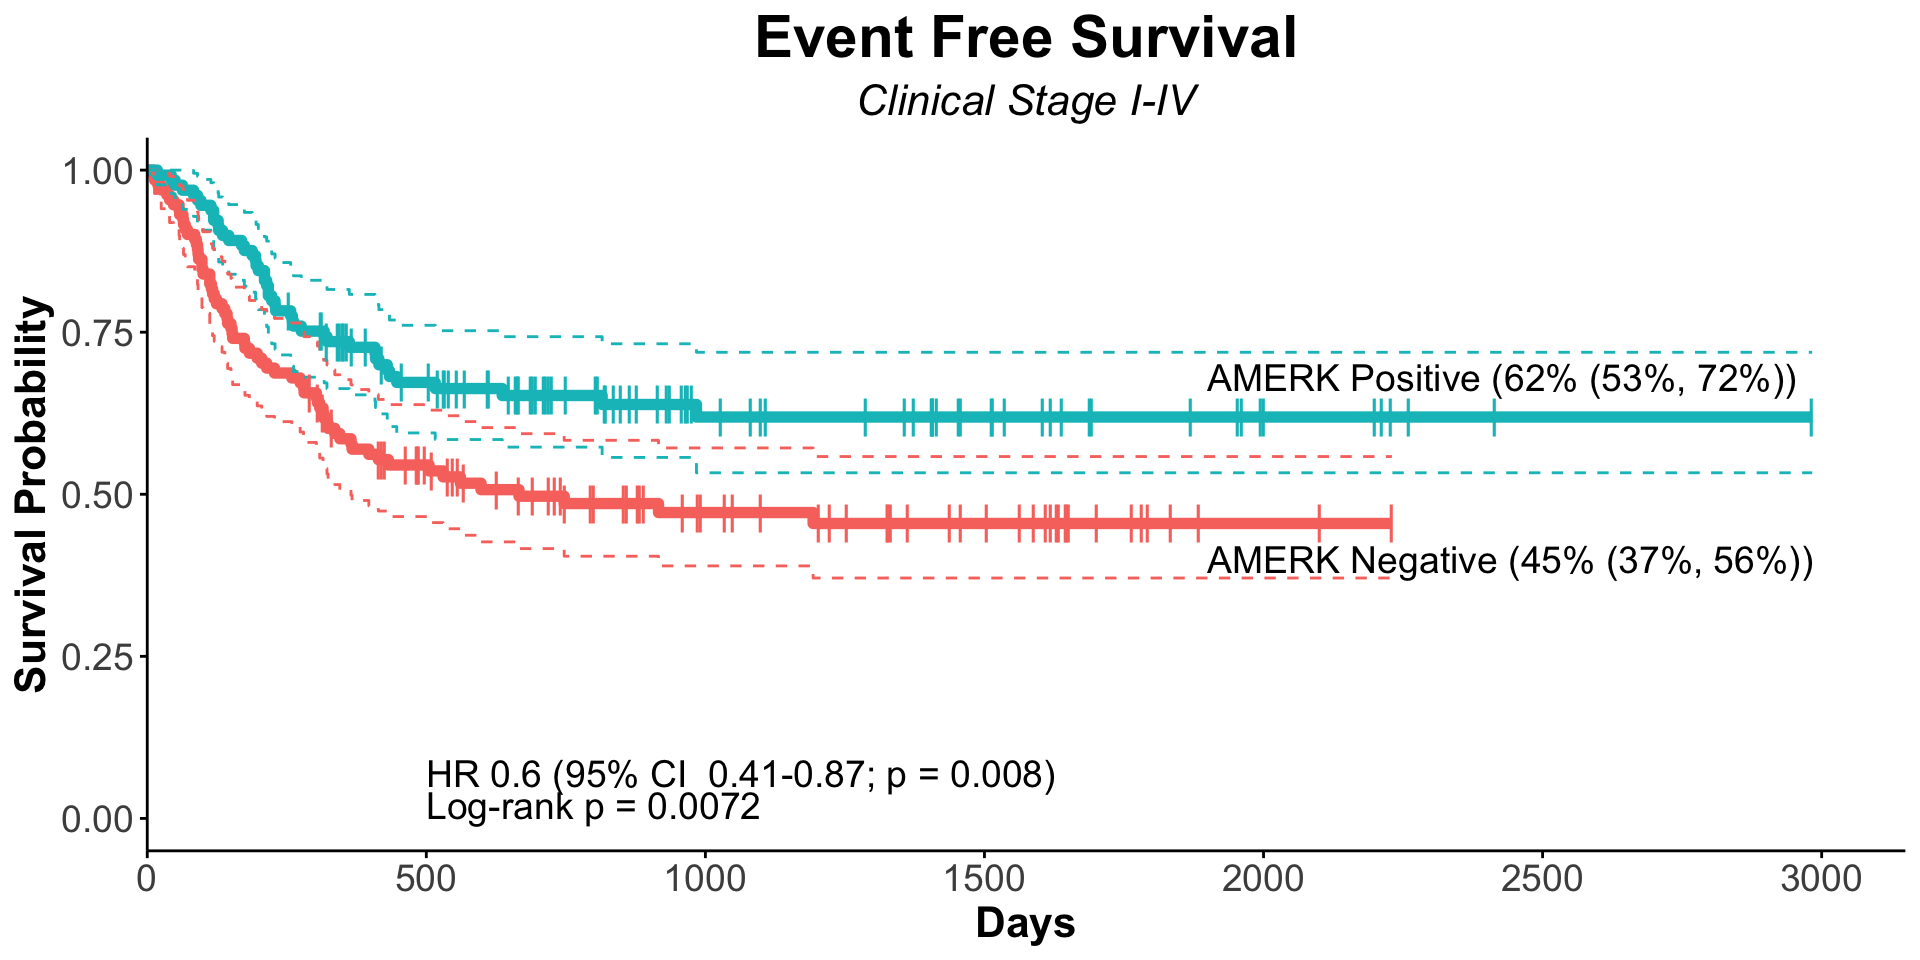
| Serostatus |
|
|
|
0.003 |
|
|
<0.001 |
| Seronegative |
127 |
— |
— |
|
— |
— |
|
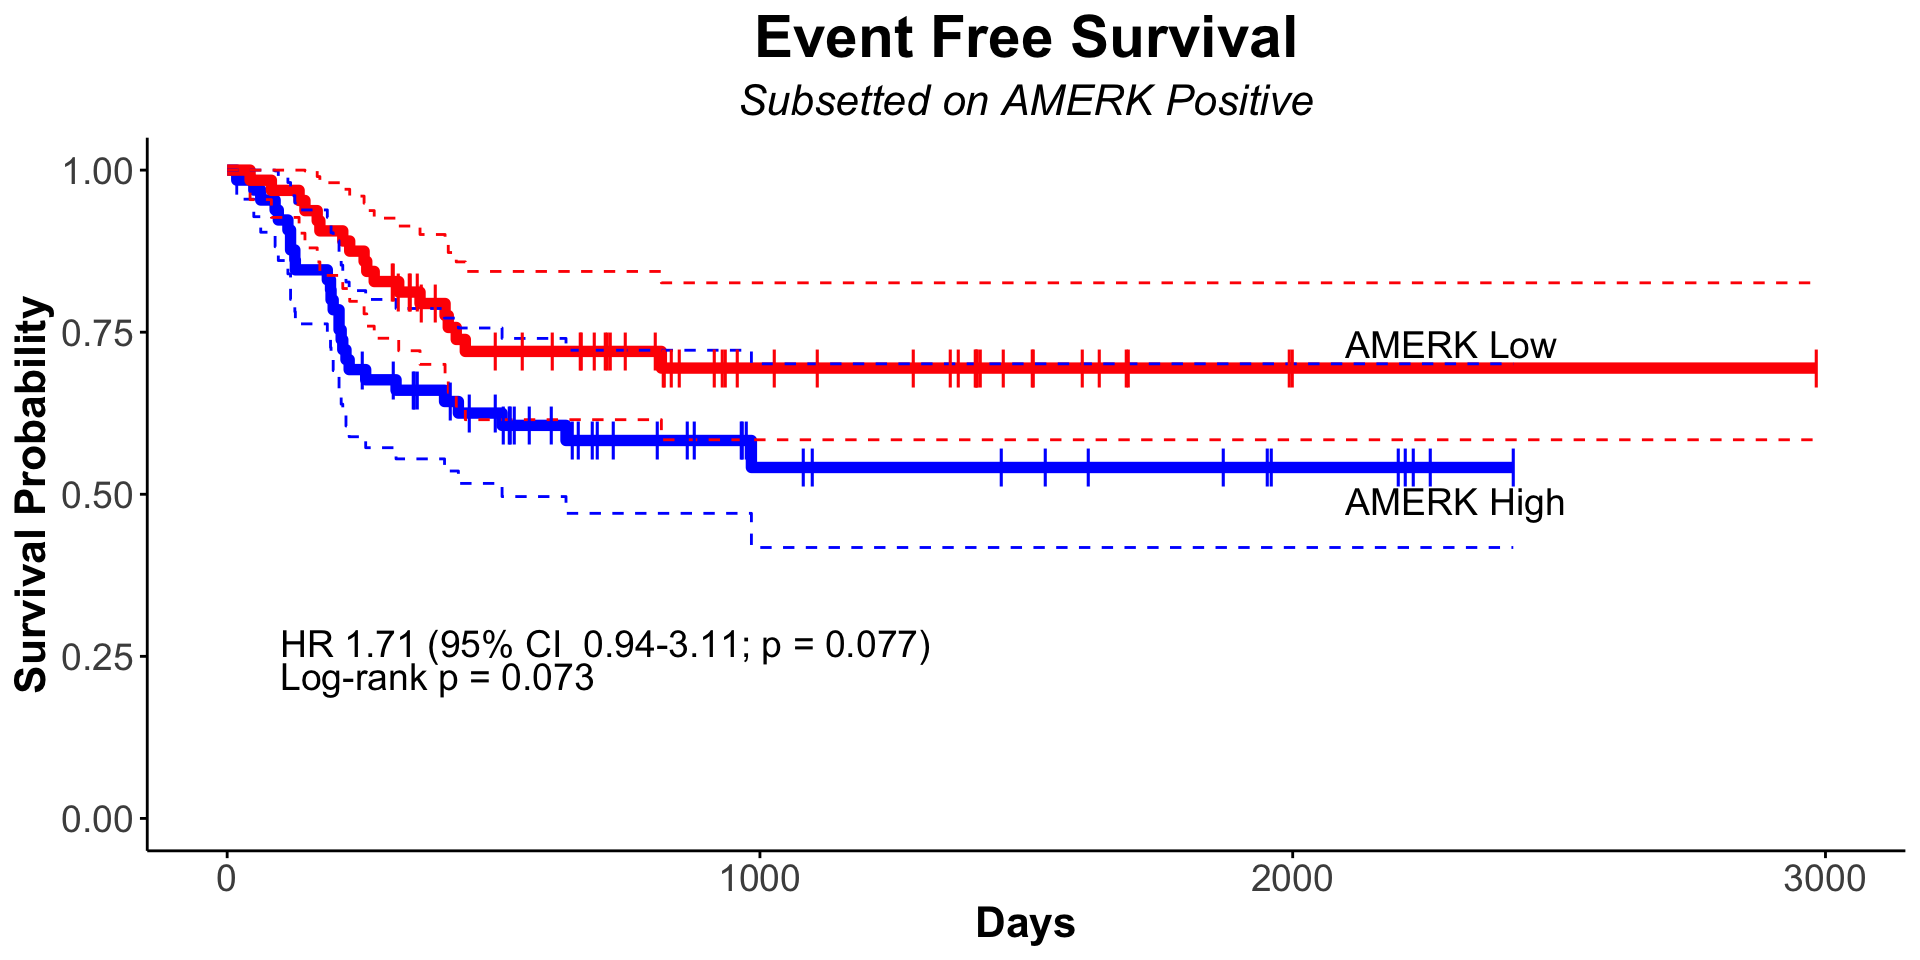
| Seropositive |
128 |
0.56 |
0.39, 0.83 |
|
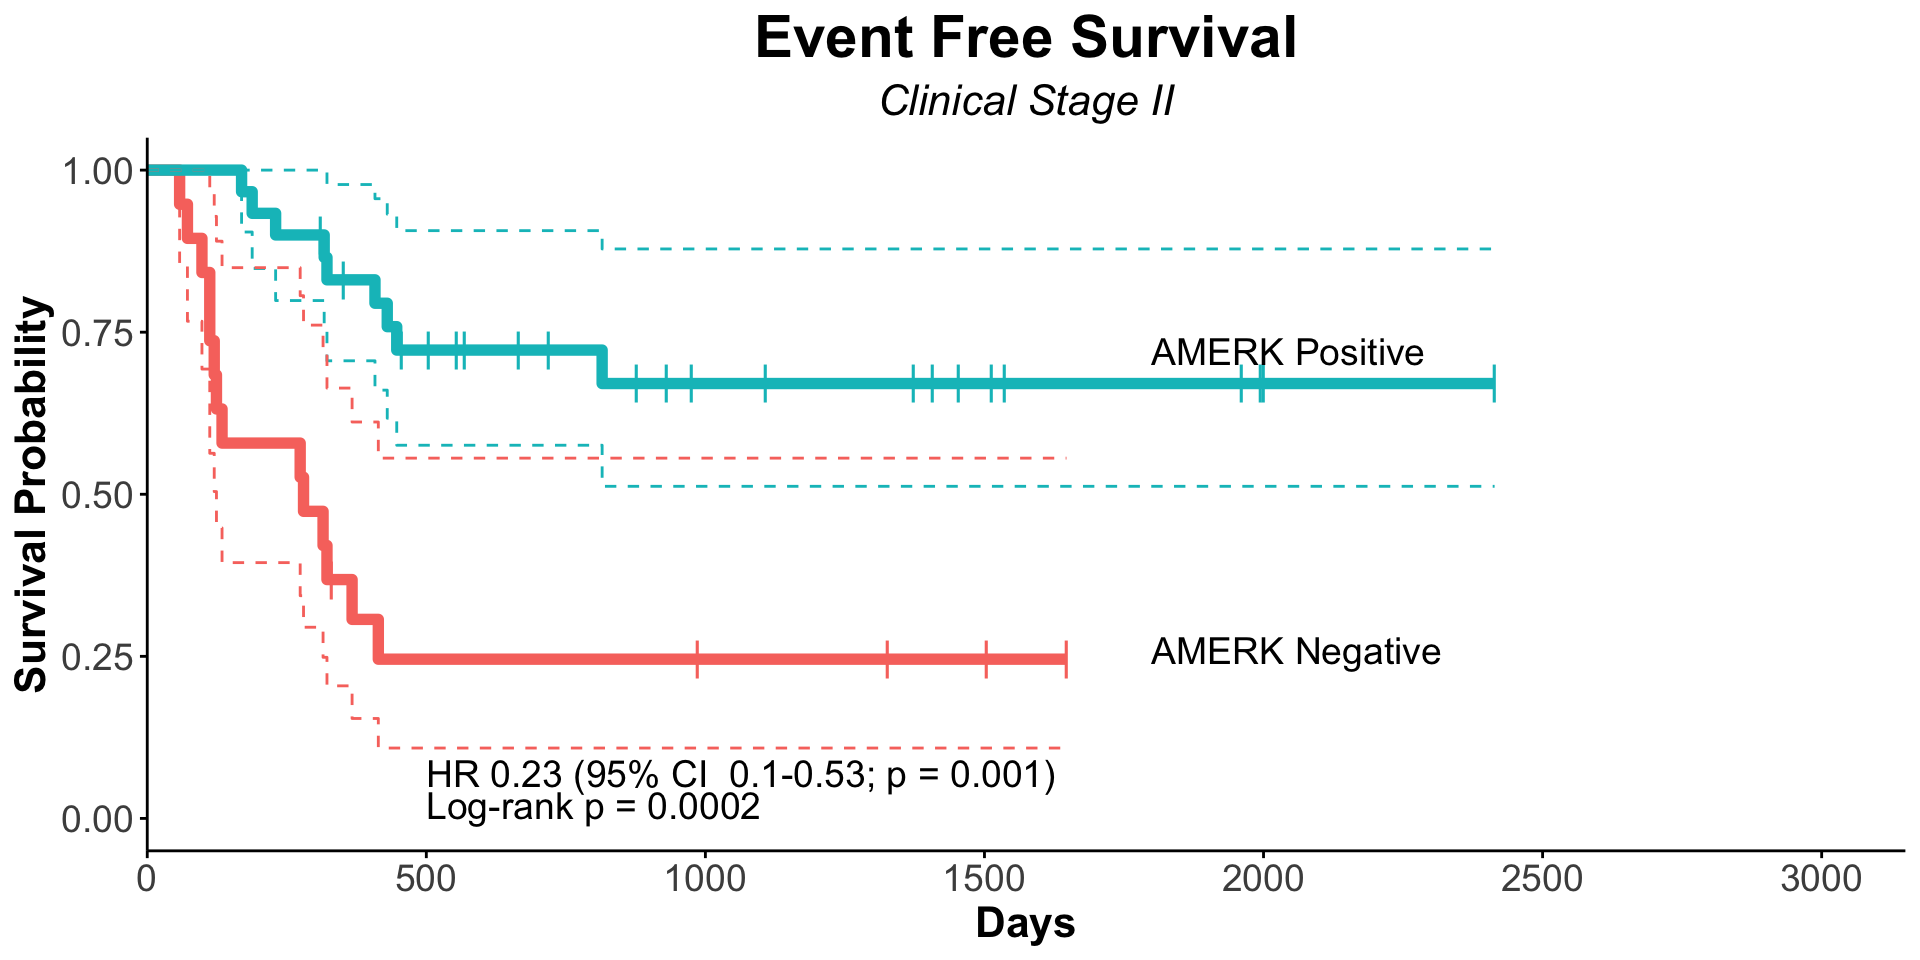
0.36 |
0.20, 0.66 |
|
| Age |
255 |
1.04 |
1.02, 1.06 |
<0.001 |
1.02 |
1.00, 1.04 |
0.12 |
| Sex |
|
|
|
0.005 |
|
|
0.055 |
| Female |
98 |
— |
— |
|
— |
— |
|
| Male |
157 |
1.77 |
1.17, 2.69 |
|
1.51 |
0.98, 2.32 |
|
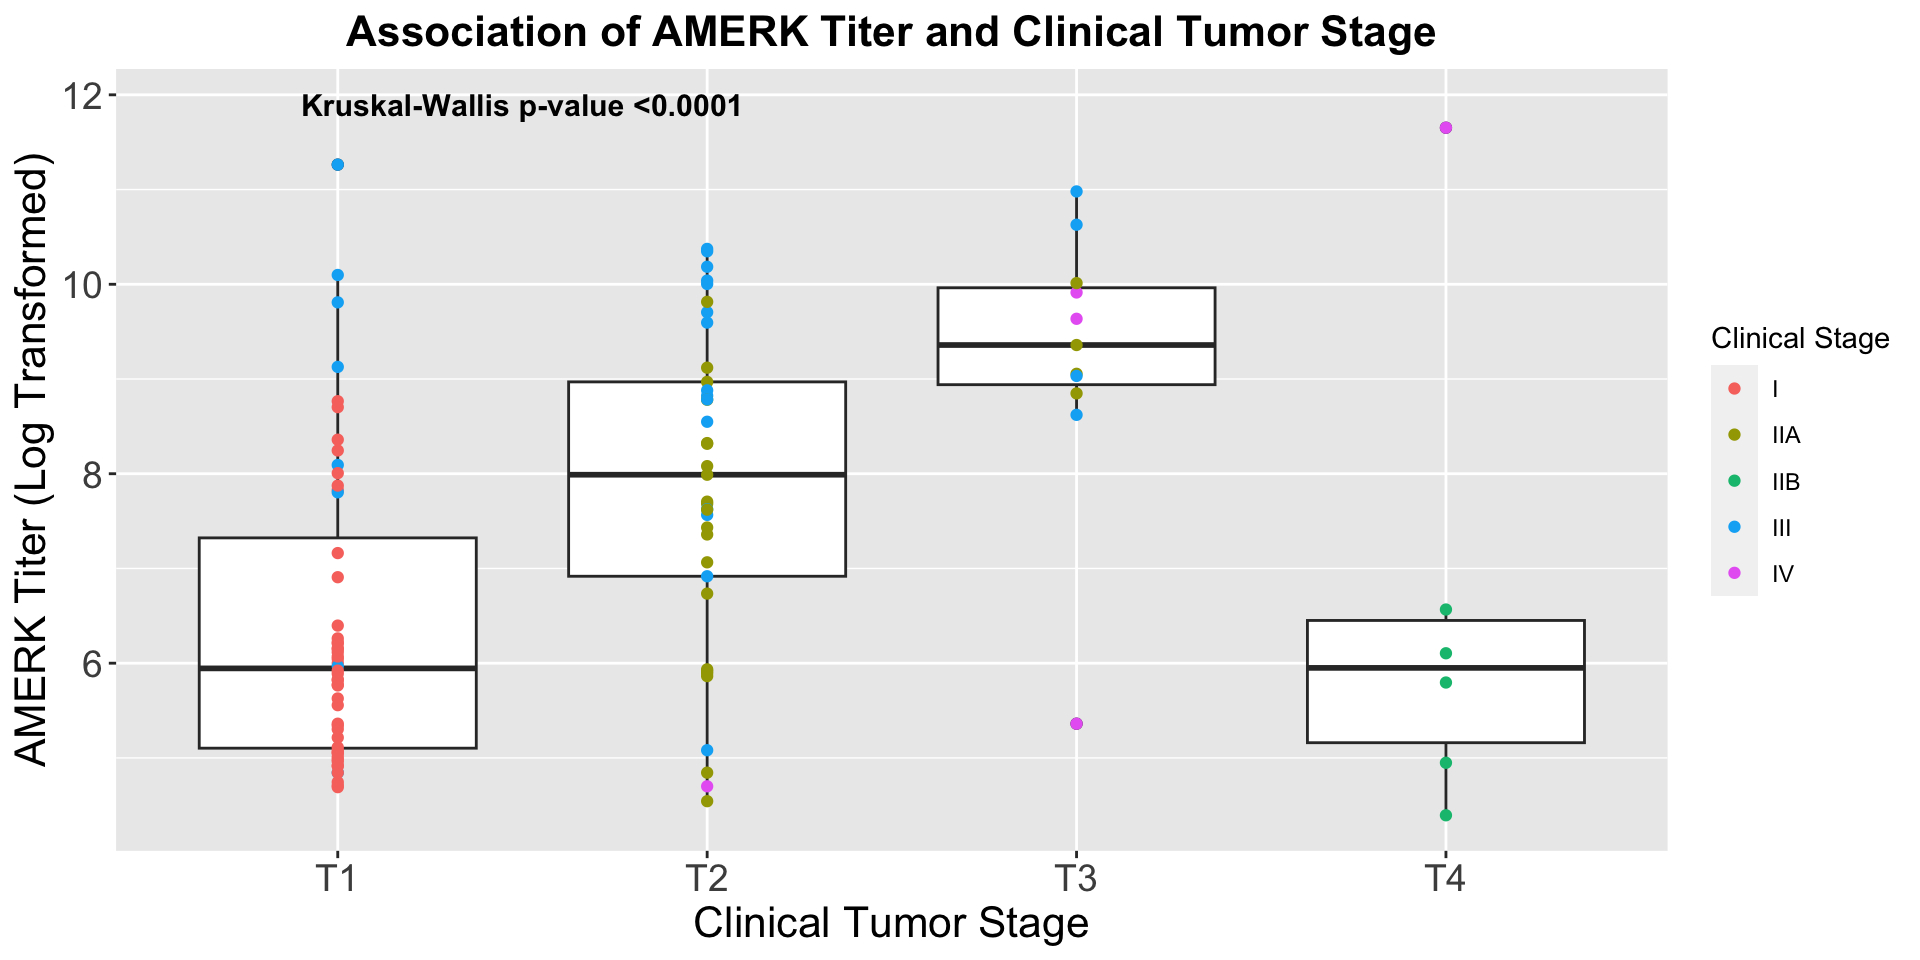
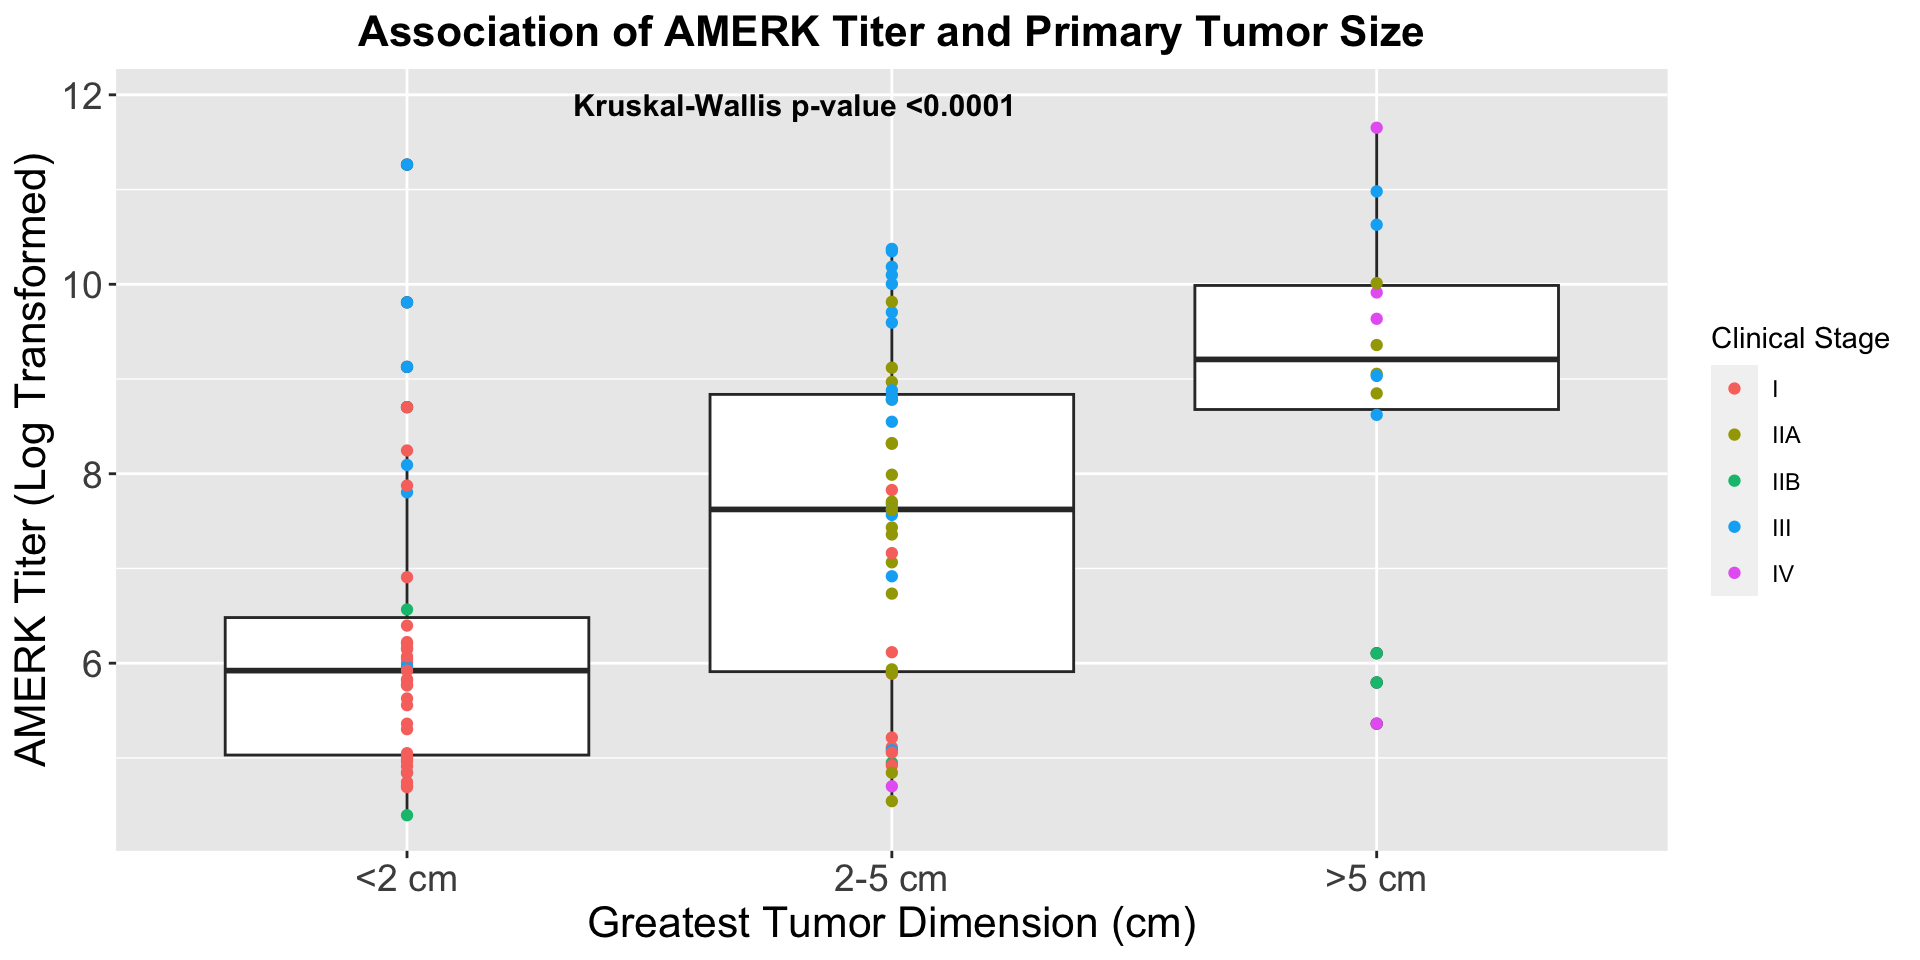
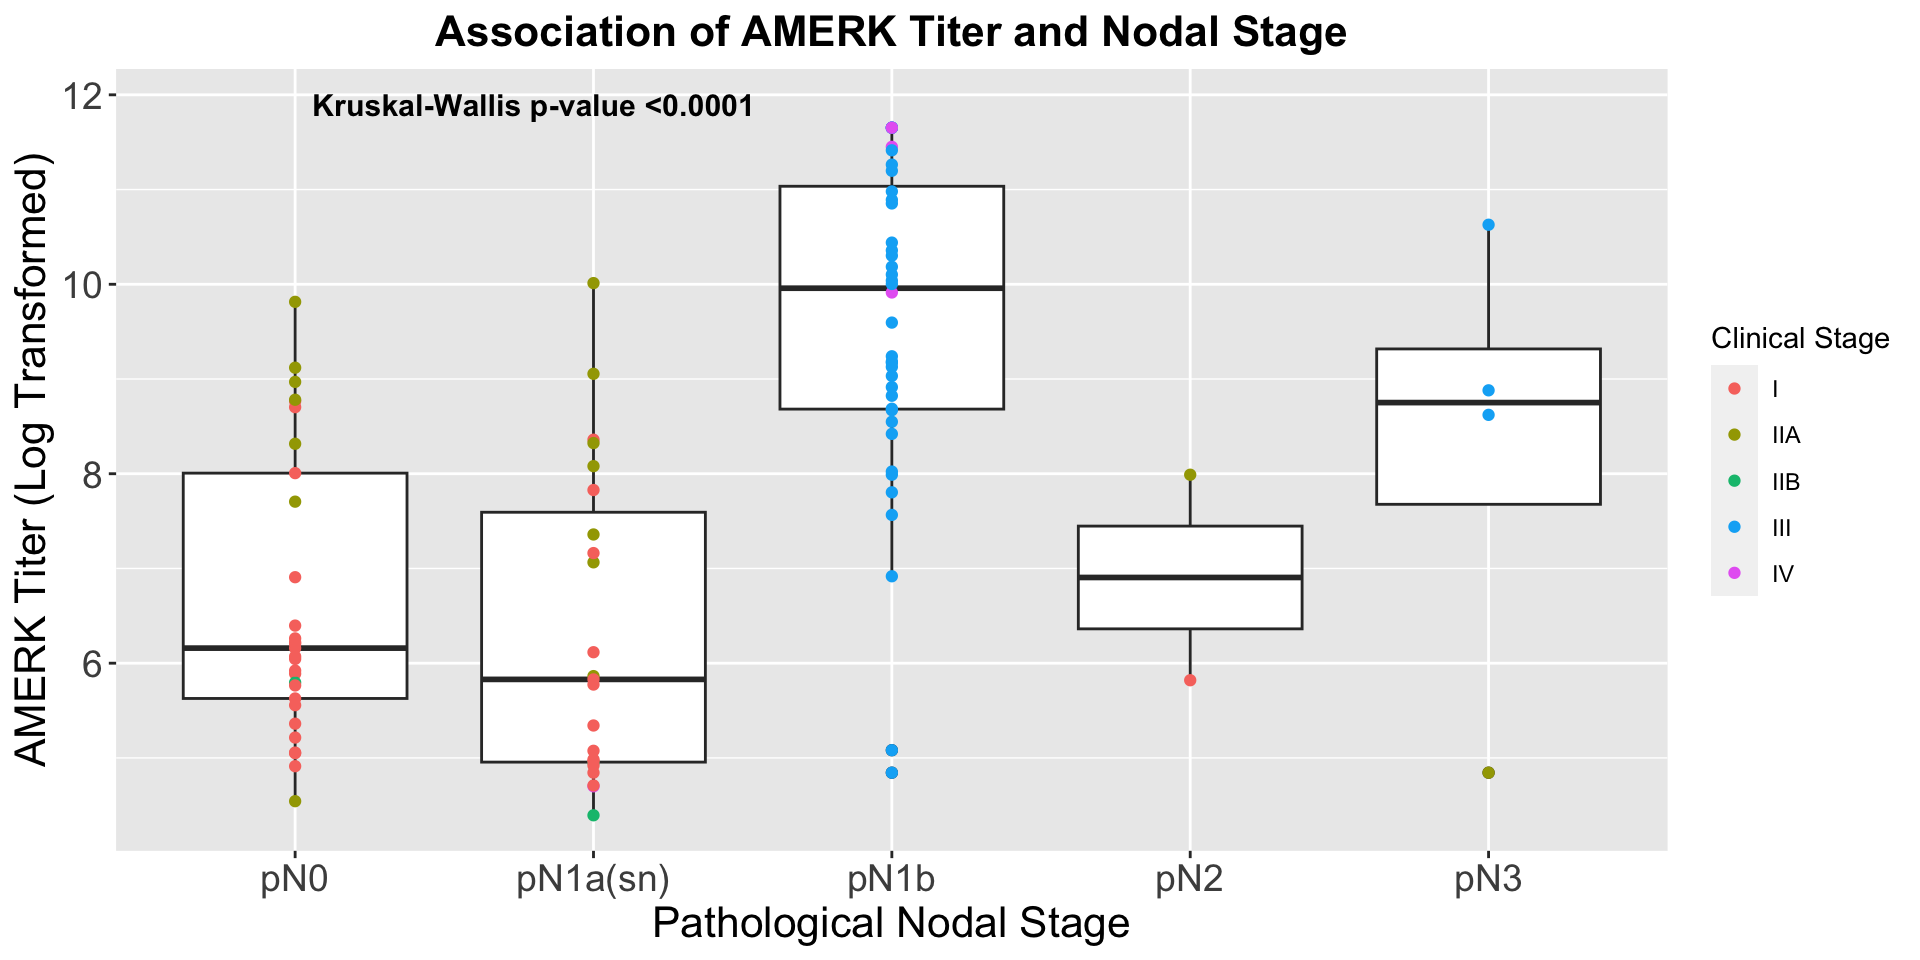
| Clinically Staged Disease Extent |
|
|
|
0.008 |
|
|
0.7 |
| Localized |
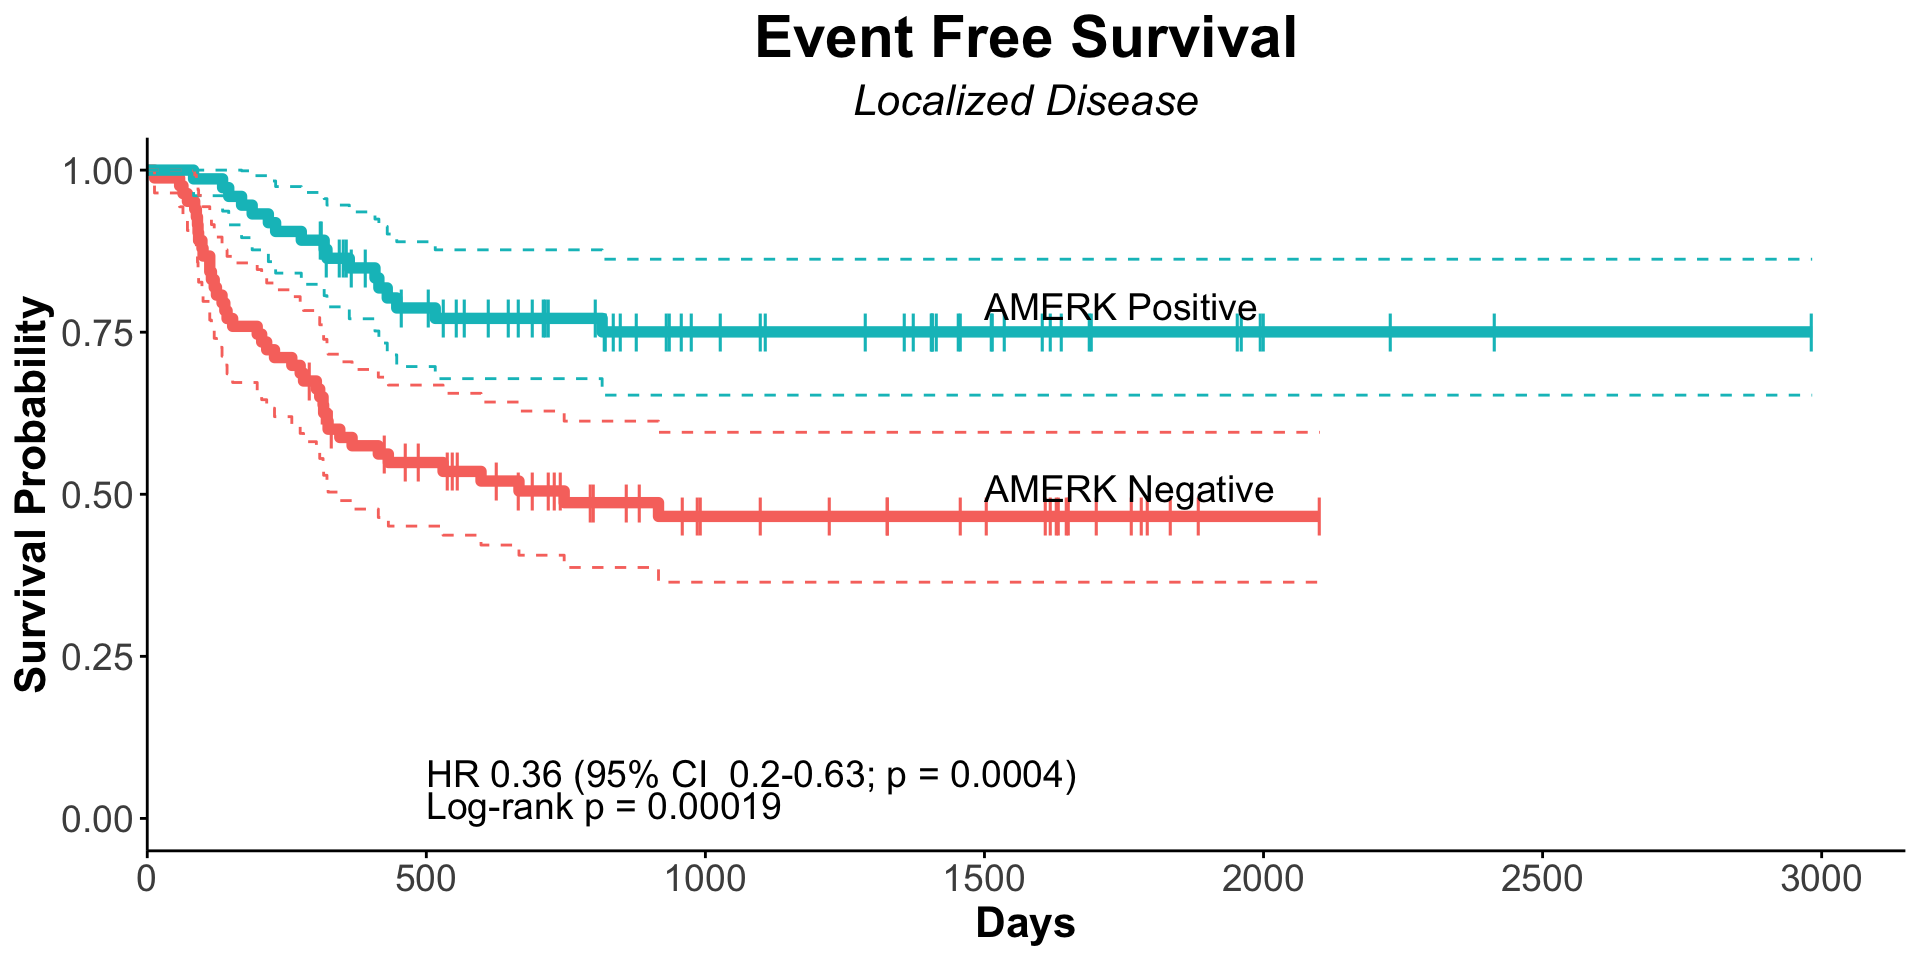
153 |
— |
— |
|
— |
— |
|
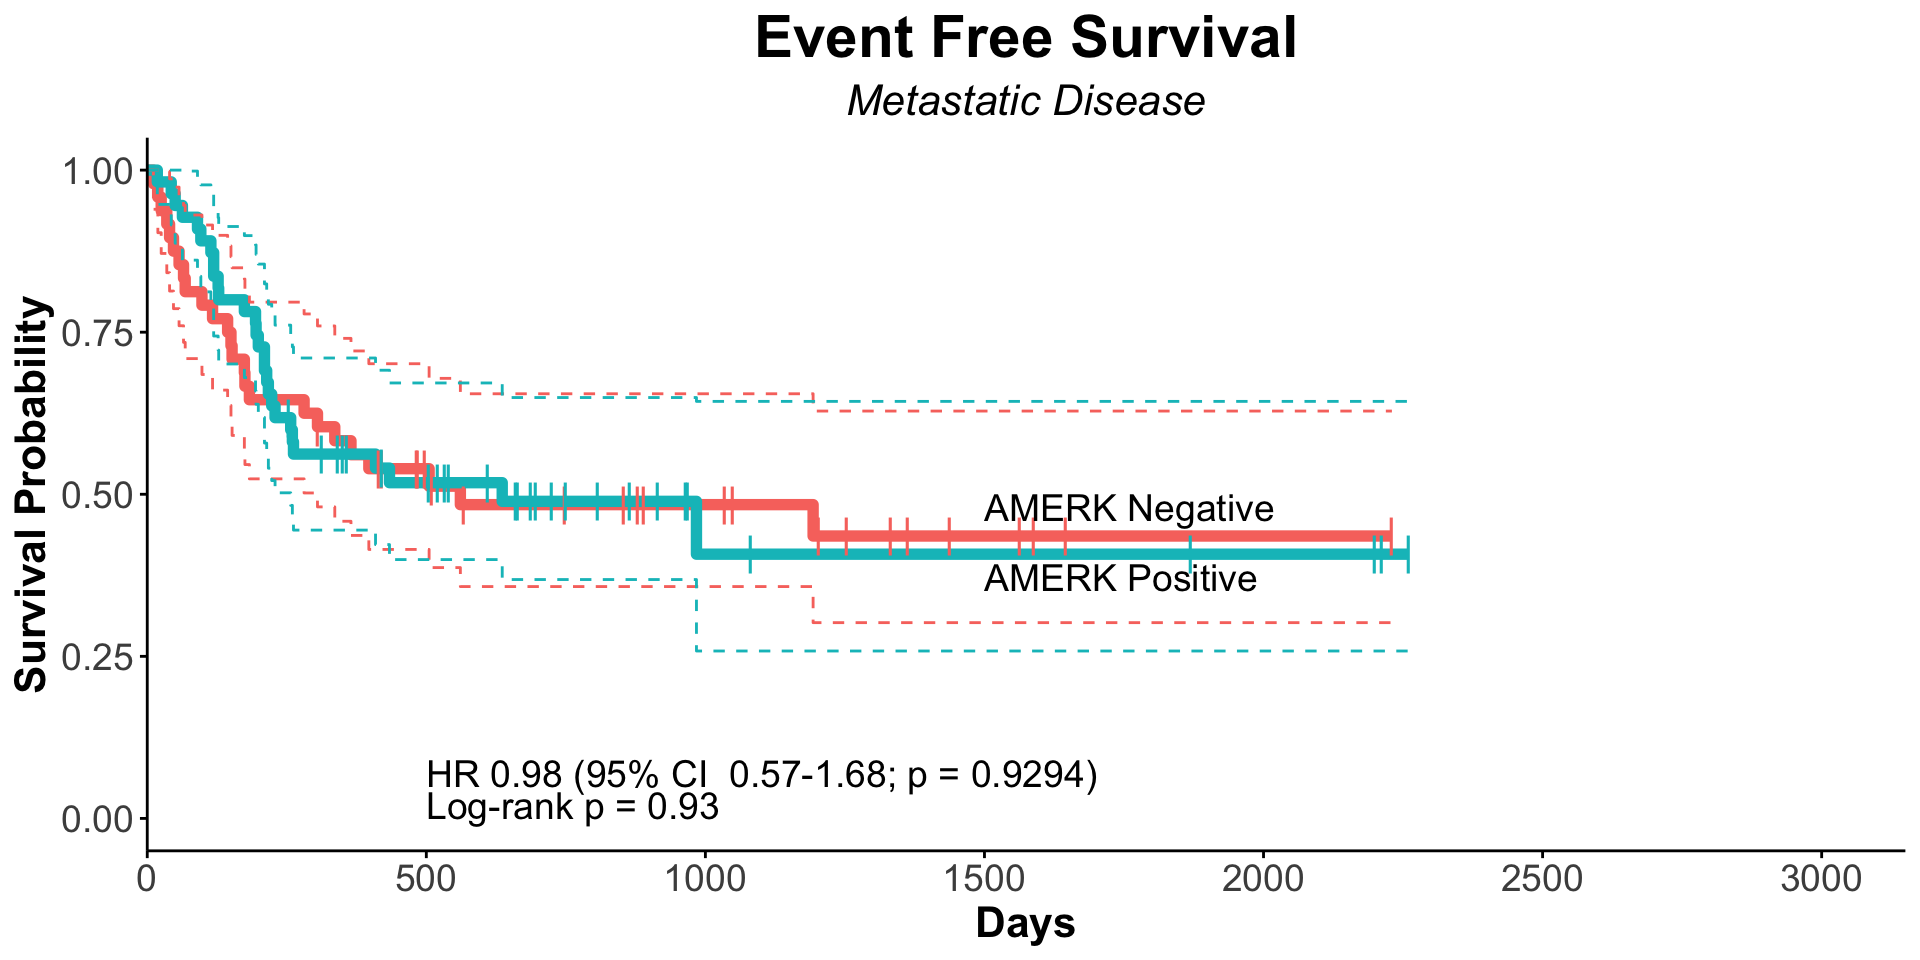
| Metastatic |
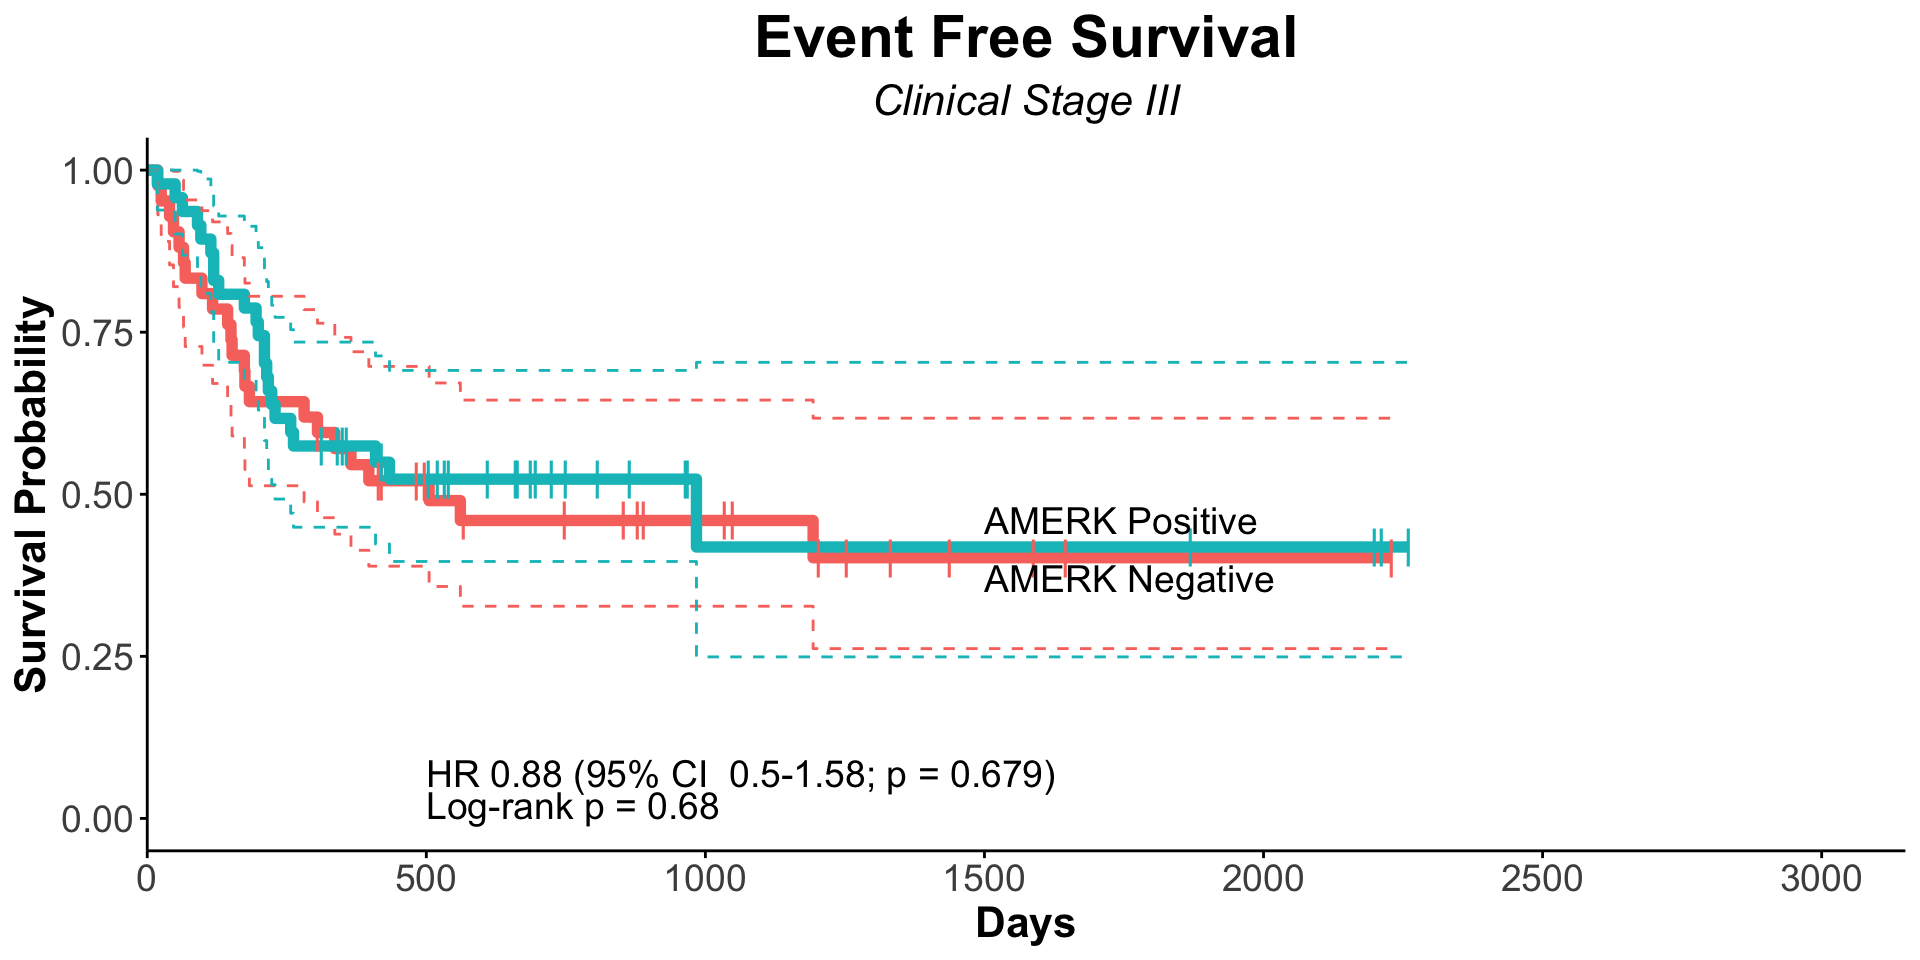
102 |
1.66 |
1.14, 2.41 |
|
1.10 |
0.62, 1.96 |
|
| Immune Suppressed |
|
|
|
0.2 |
|
|
0.8 |
| No |
213 |
— |
— |
|
— |
— |
|
| Yes |
42 |
1.33 |
0.83, 2.12 |
|
1.07 |
0.66, 1.74 |
|
| Baseline ECOG |
|
|
|
<0.001 |
|
|
0.016 |
| 0 |
145 |
— |
— |
|
— |
— |
|
| 1 |
66 |
1.95 |
1.26, 3.02 |
|
1.71 |
1.08, 2.69 |
|
| 2-4 |
44 |
3.02 |
1.89, 4.81 |
|
2.04 |
1.18, 3.56 |
|
| Initial Treatment |
|
|
|
<0.001 |
|
|
0.086 |
| Surgery Alone |
33 |
— |
— |
|
— |
— |
|
| Surgical Excision, Adjuvant Radiation |
126 |
0.45 |
0.26, 0.78 |
|
0.57 |
0.31, 1.02 |
|
| Primary-Definitive Radiation |
46 |
1.36 |
0.76, 2.43 |
|
1.07 |
0.56, 2.06 |
|
| Chemotherapy |
4 |
0.71 |
0.16, 3.06 |
|
0.82 |
0.18, 3.75 |
|
| Immunotherapy |
45 |
0.81 |
0.43, 1.53 |
|
0.62 |
0.30, 1.29 |
|
| Hospice |
1 |
3.88 |
0.51, 29.5 |
|
4.46 |
0.53, 37.3 |
|
| Serostatus * Disease Extent Interaction |
|
|
|
|
|
|
0.007 |
| Seropositive * Metastatic |
|
|
|
|
3.05 |
1.34, 6.91 |
|